When non-Newtonian fluid simulations improve process decisions




For technical evaluators, non-Newtonian fluid simulations turn complex polymer behavior into clearer process decisions. In injection molding, extrusion, vulcanization, and recycling, they show how viscosity changes under shear, heat, and pressure. That visibility reduces trial runs, improves consistency, and supports smarter equipment comparison, process tuning, and capital planning across polymer manufacturing operations.
Why non-Newtonian fluid simulations deserve a checklist approach
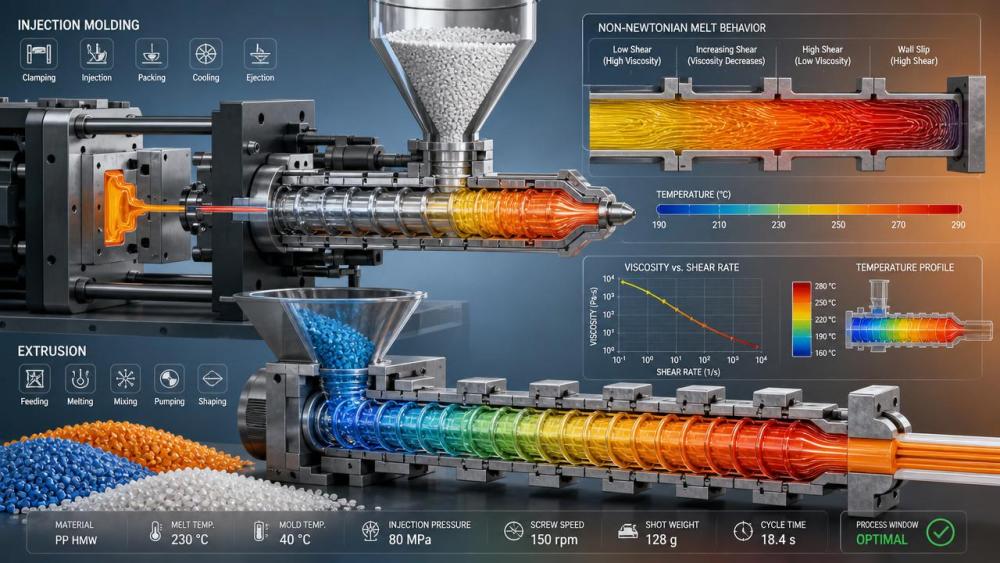
Polymer flow is rarely simple. Melt viscosity may drop under shear, rise with fillers, or shift quickly with temperature. A simulation result can look impressive, yet still mislead if the material model, boundary conditions, or machine assumptions are weak.
A checklist helps separate attractive visuals from decision-grade evidence. It keeps reviews focused on measurable process outcomes: pressure stability, residence time, thermal exposure, mixing quality, scrap risk, energy demand, and final part consistency.
For a broad industrial audience, that matters because the same evaluation logic can support several asset types. The decision may involve an injection molding cell, a twin-screw extruder, a blow molding line, a vulcanizing press, or a recycling pelletizing system.
Core checklist for evaluating process value
Use the following checklist to judge whether non-Newtonian fluid simulations are improving real process decisions rather than adding isolated engineering detail.
- Verify material data first. Match the rheology model to real shear-rate and temperature ranges, especially for filled, recycled, reactive, or moisture-sensitive polymer systems.
- Check pressure predictions against plant data. Useful non-Newtonian fluid simulations should narrow uncertainty around injection pressure, die pressure, and screw load limits.
- Compare thermal history, not only flow pattern. Local overheating, stagnation, and long residence zones often predict degradation before defects become visible.
- Review shear distribution across channels, gates, screws, and dies. Uneven shear usually drives variation in gloss, mechanical strength, color dispersion, or dimensional stability.
- Measure sensitivity to operating windows. Strong simulations should show how small shifts in melt temperature, screw speed, or hold pressure affect quality margins.
- Inspect wall slip, filler orientation, and viscoelastic effects where relevant. Ignoring them can make non-Newtonian fluid simulations look stable while production remains inconsistent.
- Link outputs to business metrics. Favor models that explain scrap rate, throughput, energy use, cleaning frequency, tool wear, or changeover reliability.
- Test scale-up logic carefully. A result proven in a lab extruder or pilot mold does not automatically transfer to full-size equipment geometry.
- Confirm mesh and boundary quality. Poor discretization near gates, screw flights, dead zones, or die lips can distort high-value conclusions.
- Demand validation loops. The best non-Newtonian fluid simulations are updated with pressure, temperature, torque, and part-quality feedback from actual runs.
Where these simulations create measurable value
Injection molding
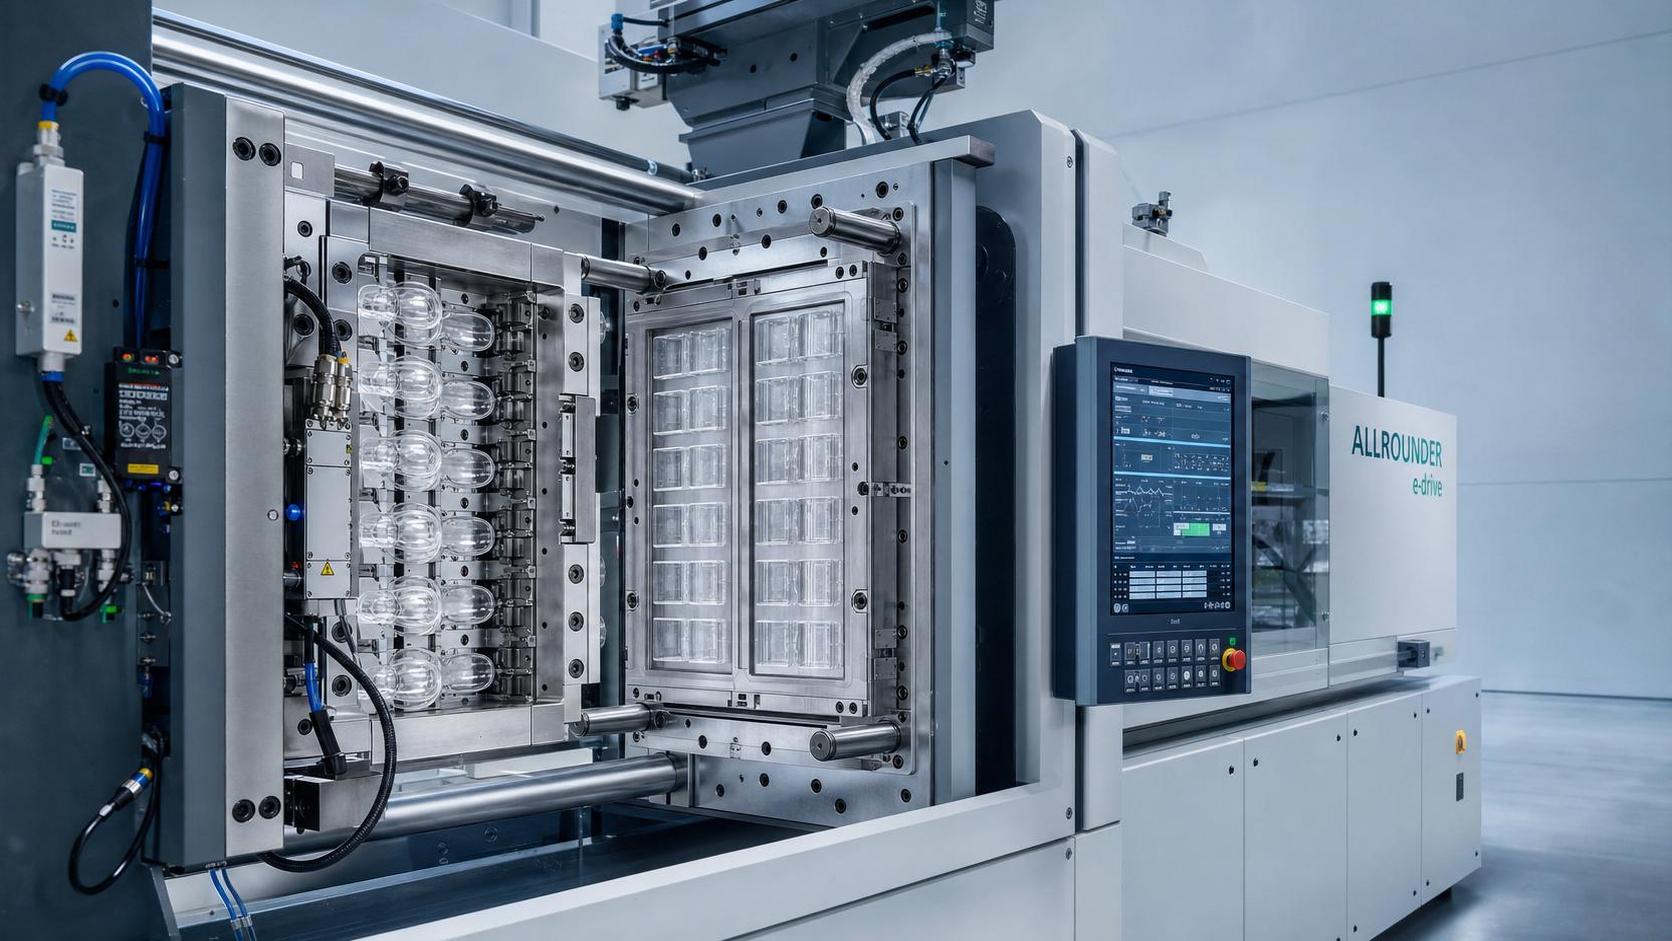
In injection molding, non-Newtonian fluid simulations help compare gate layouts, runner balance, fill time, and holding pressure strategies. They are especially useful when tolerances are tight, wall thickness varies, or the resin has strong shear-thinning behavior.
Decision value increases when simulation outputs are tied to weld lines, sink risk, flash tendency, clamp force demand, and cavity-to-cavity variation. This turns software results into direct tool design and machine selection evidence.
Extrusion and compounding
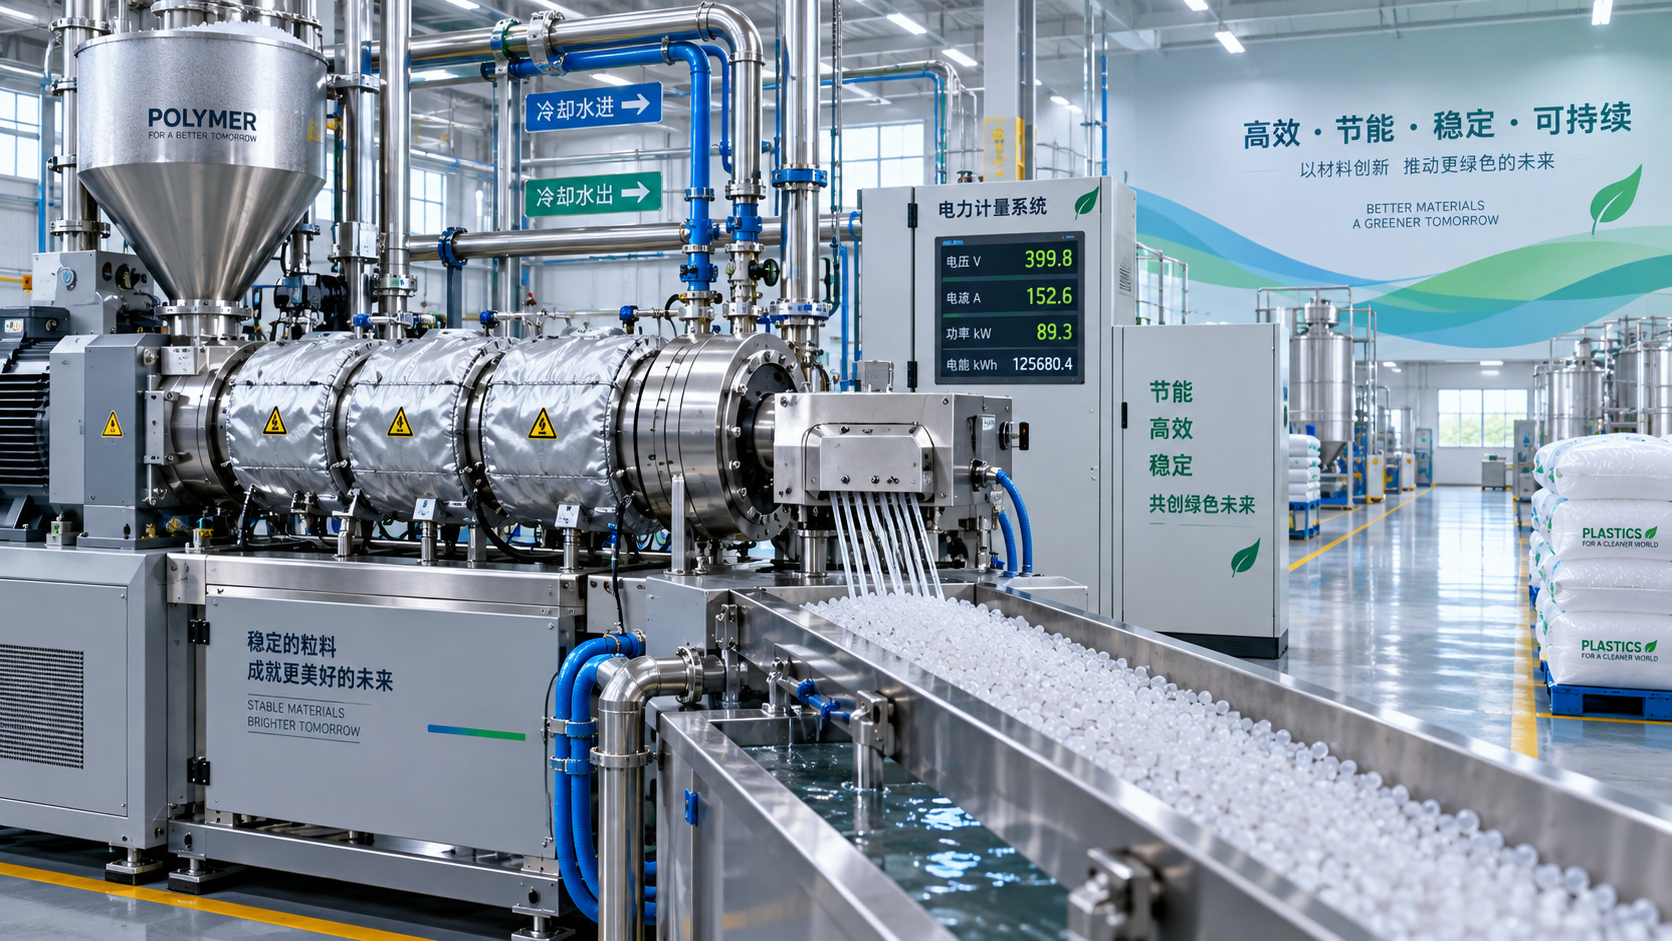
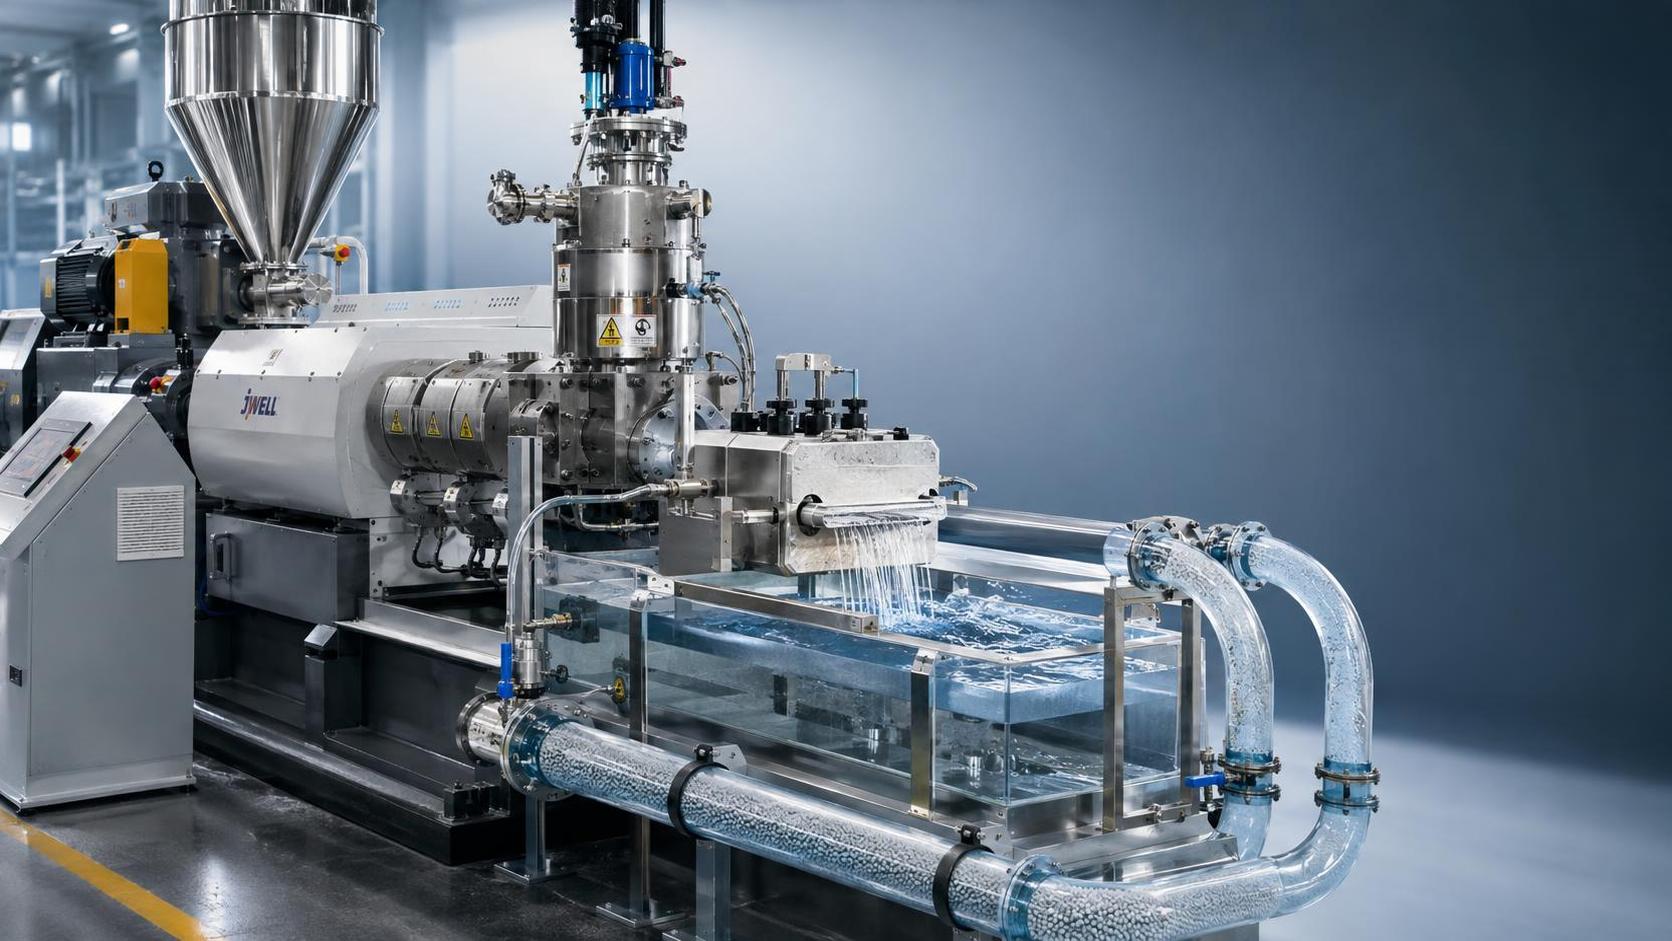
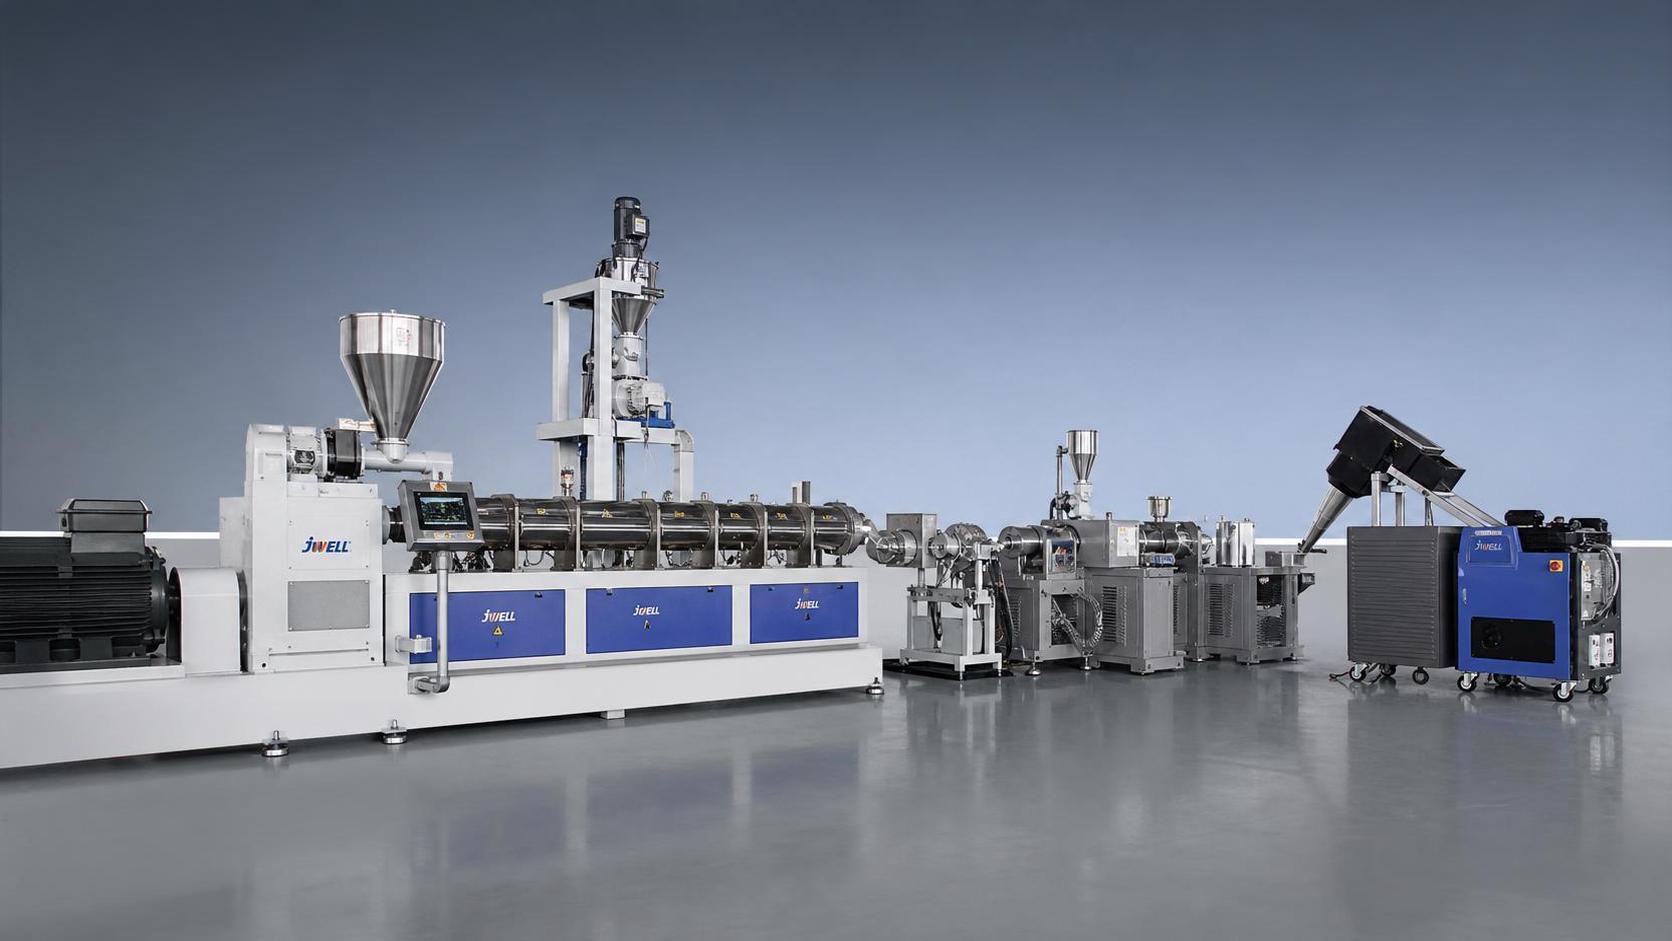
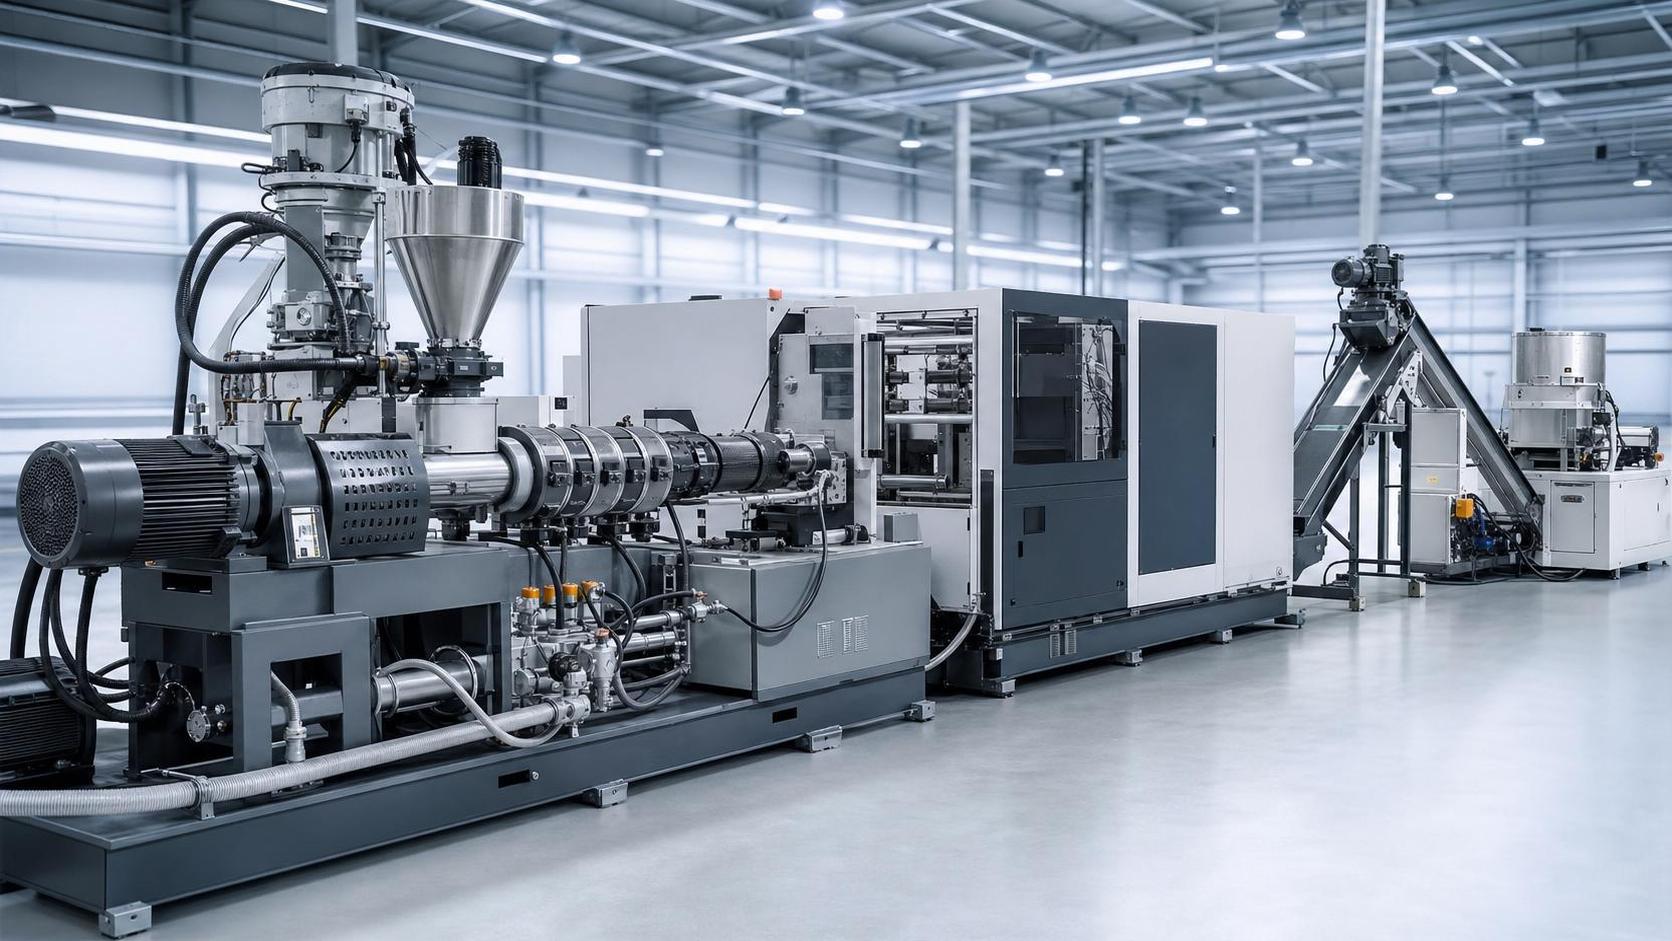
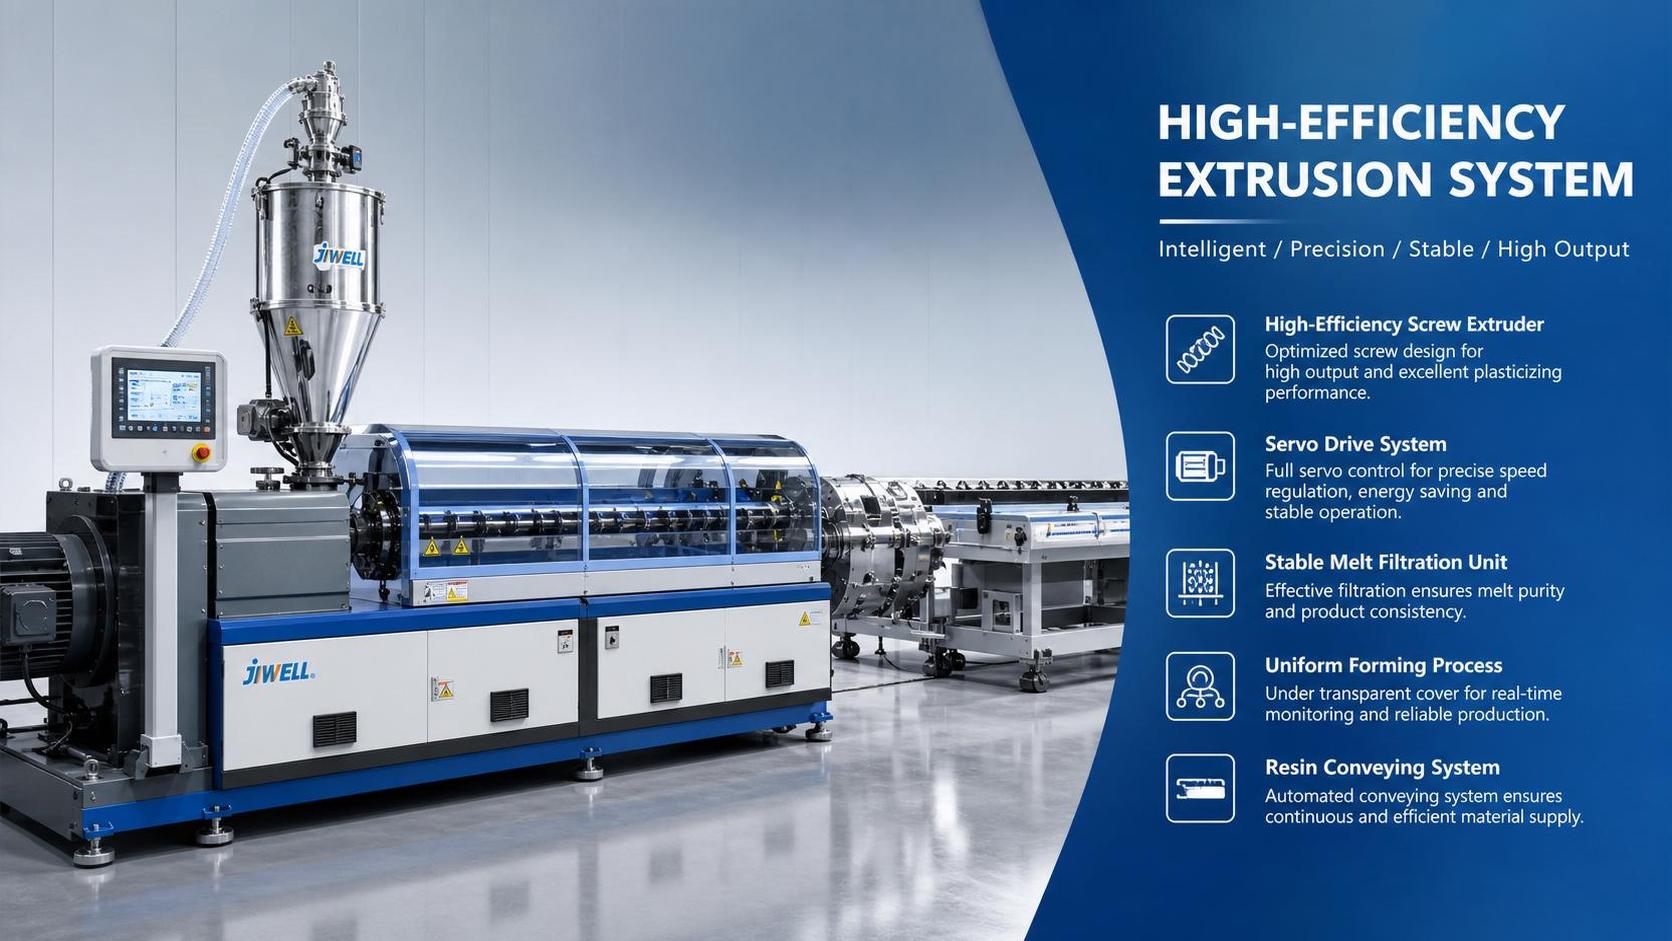
For extrusion, the biggest gains often come from screw design, die uniformity, and melt temperature control. Non-Newtonian behavior strongly affects pressure build-up, distributive mixing, dispersive mixing, and output stability.
In twin-screw compounding, non-Newtonian fluid simulations can identify where additives disperse well and where they overheat. That supports better barrel zoning, element arrangement, and throughput decisions without excessive physical trials.
Blow molding and packaging lines
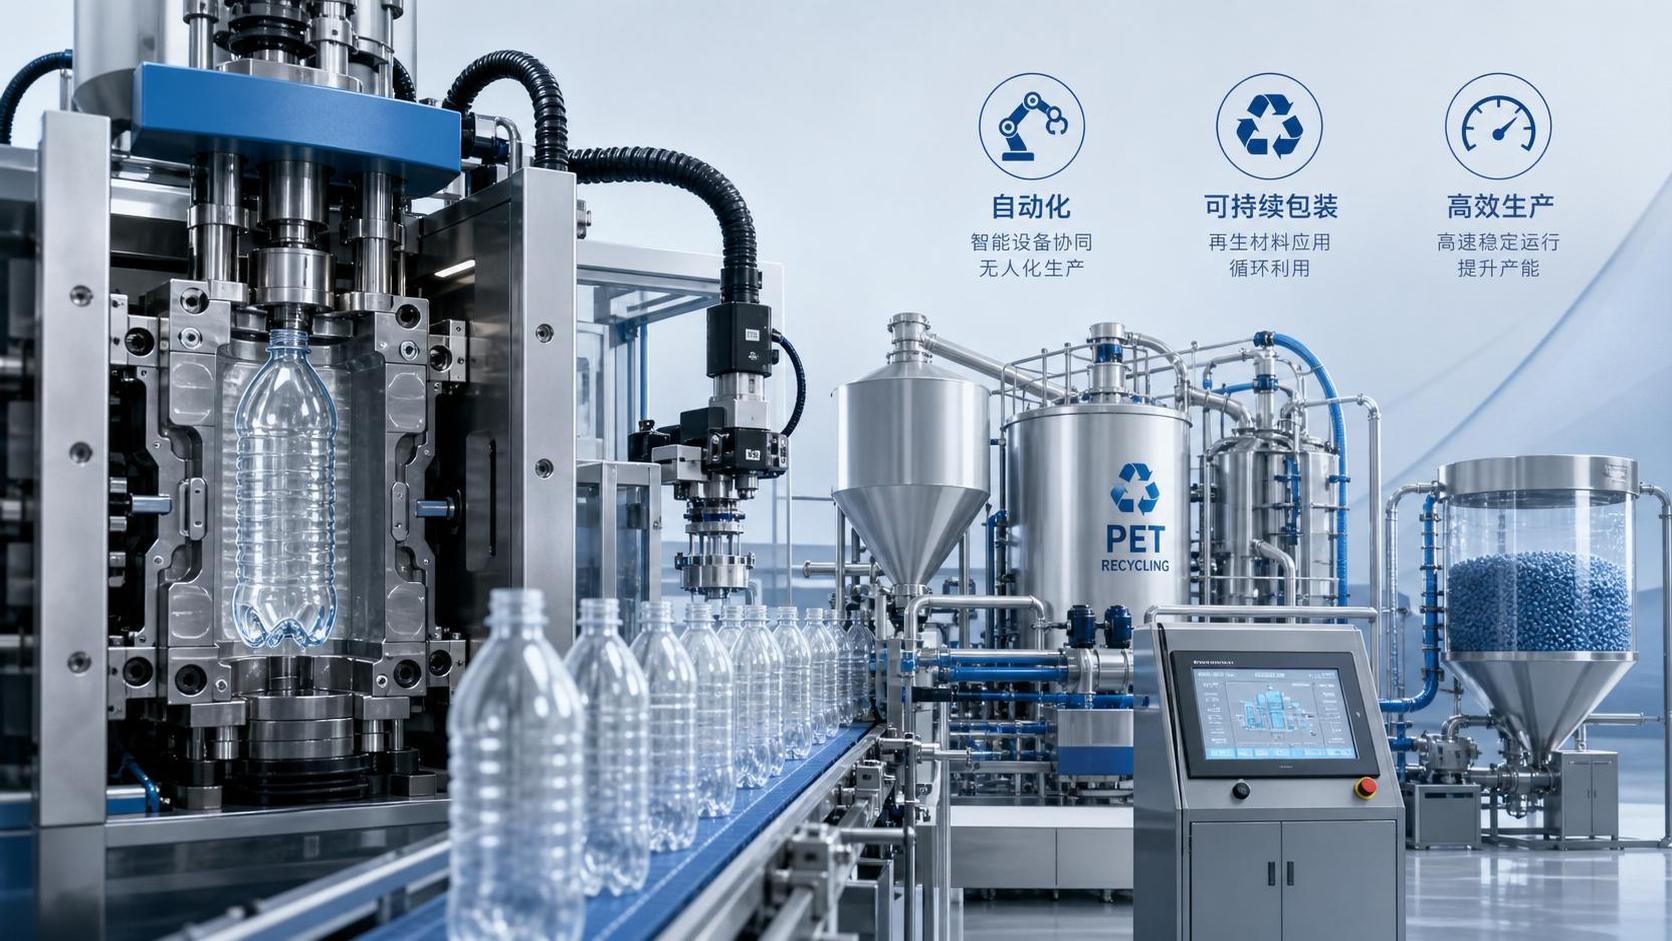
In blow molding, simulations help evaluate parison behavior, thickness distribution, and melt strength limits. Packaging lines benefit when models explain why bottles drift in weight, burst performance, or wall consistency.
This is valuable when output targets are high and resin costs are rising. Better prediction of flow and draw behavior can reduce overdesign while protecting top-load and barrier performance.
Rubber processing and vulcanization
Rubber compounds introduce additional complexity through strong viscoelasticity, filler networks, and heat generation during flow. Here, non-Newtonian fluid simulations support mold filling review, venting logic, and compound distribution before curing dominates behavior.
They are most useful when linked with cure kinetics and thermal gradients. That combination helps explain trapped air, underfill, scorch risk, and uneven mechanical properties across the finished part.
Recycling and pelletizing
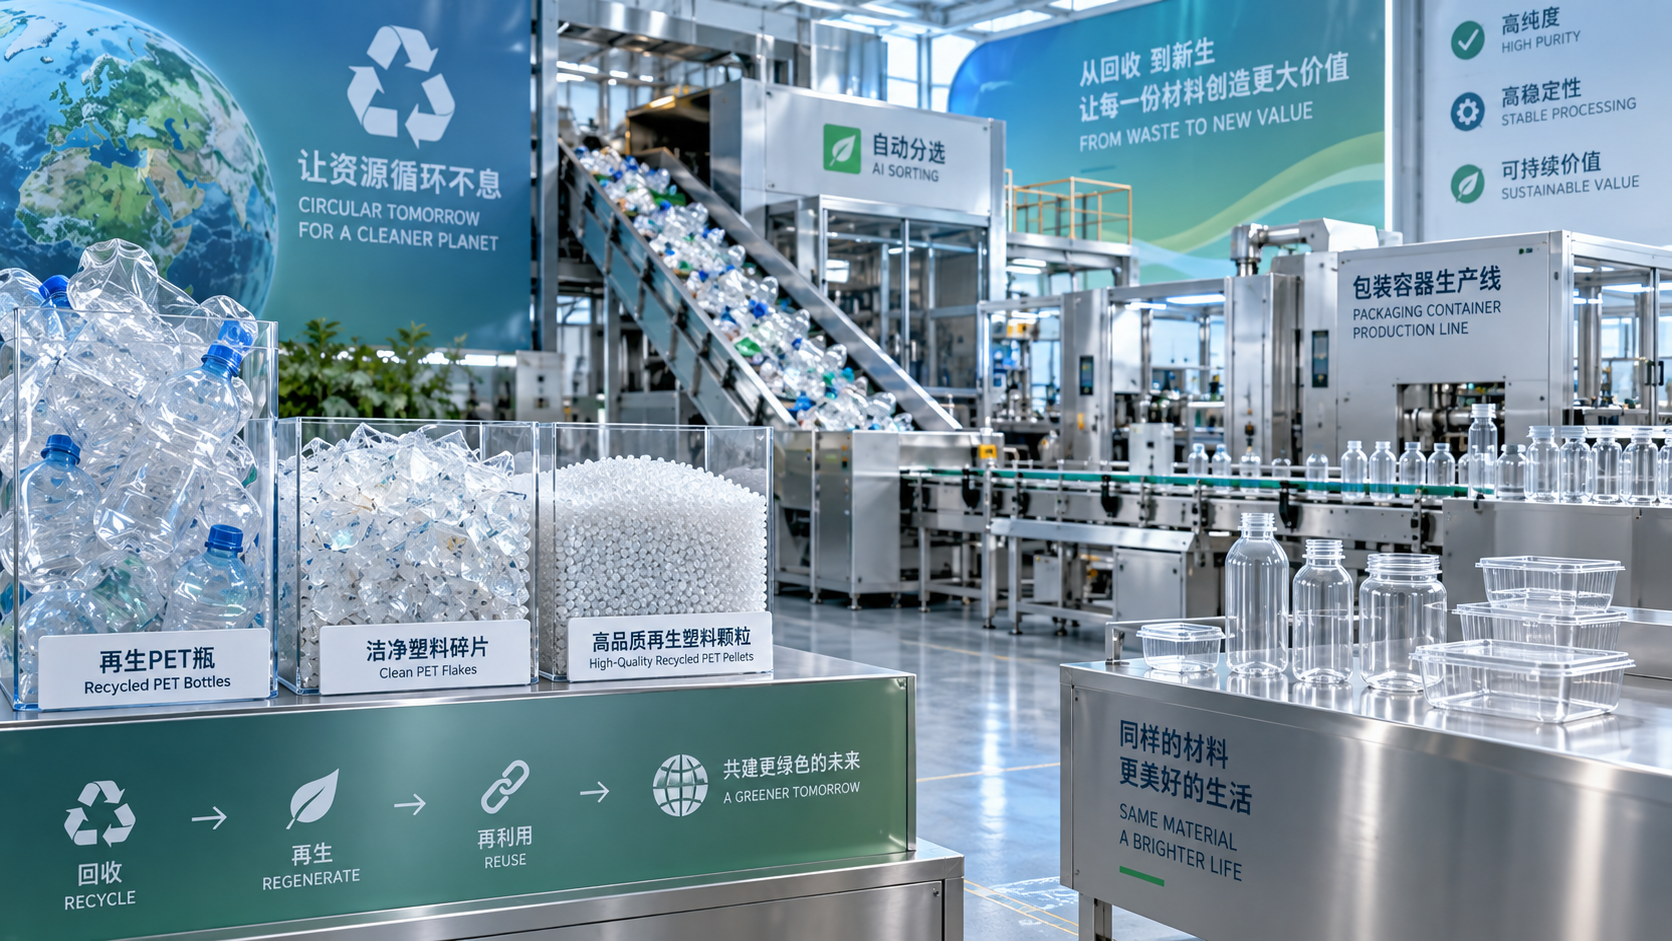
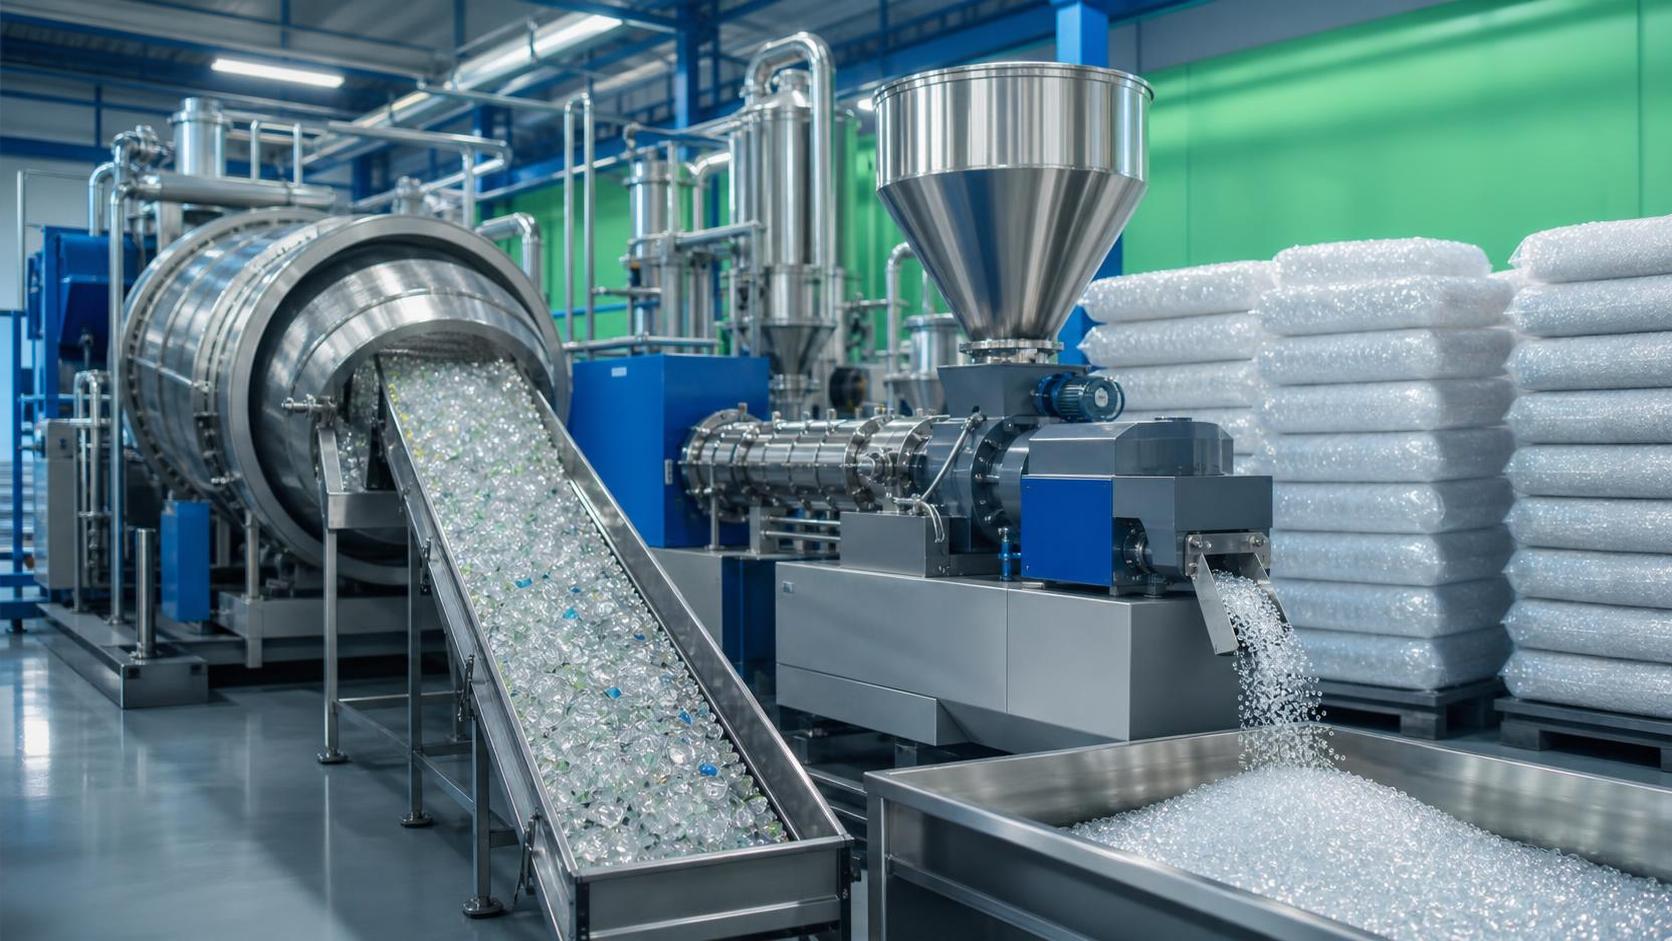
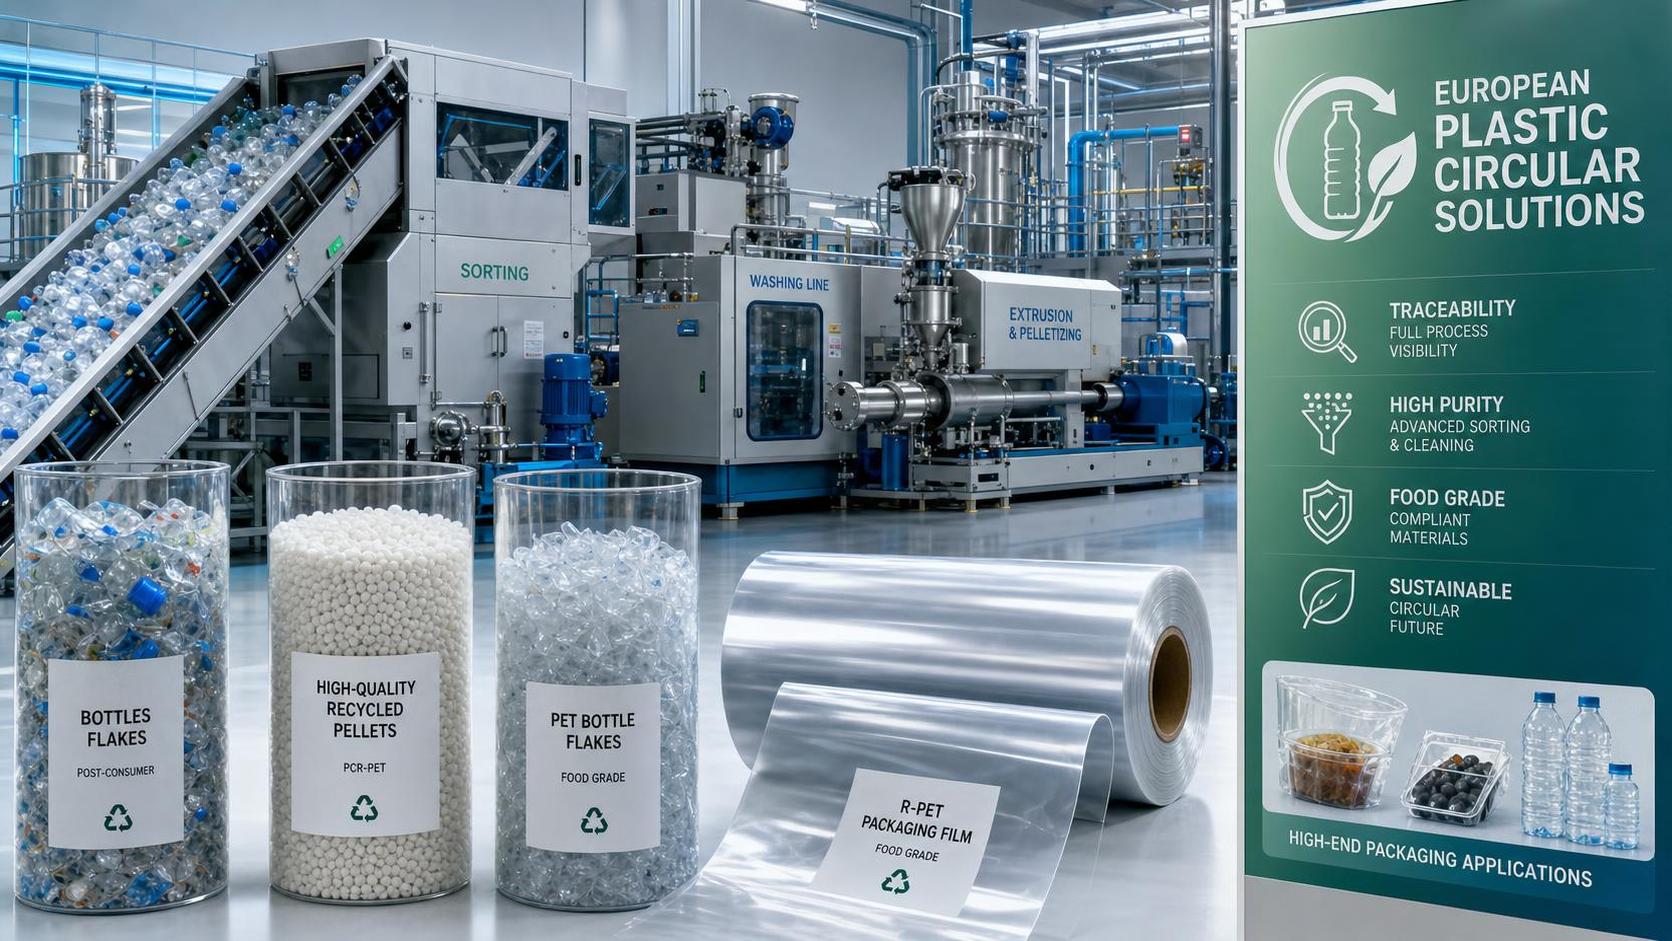
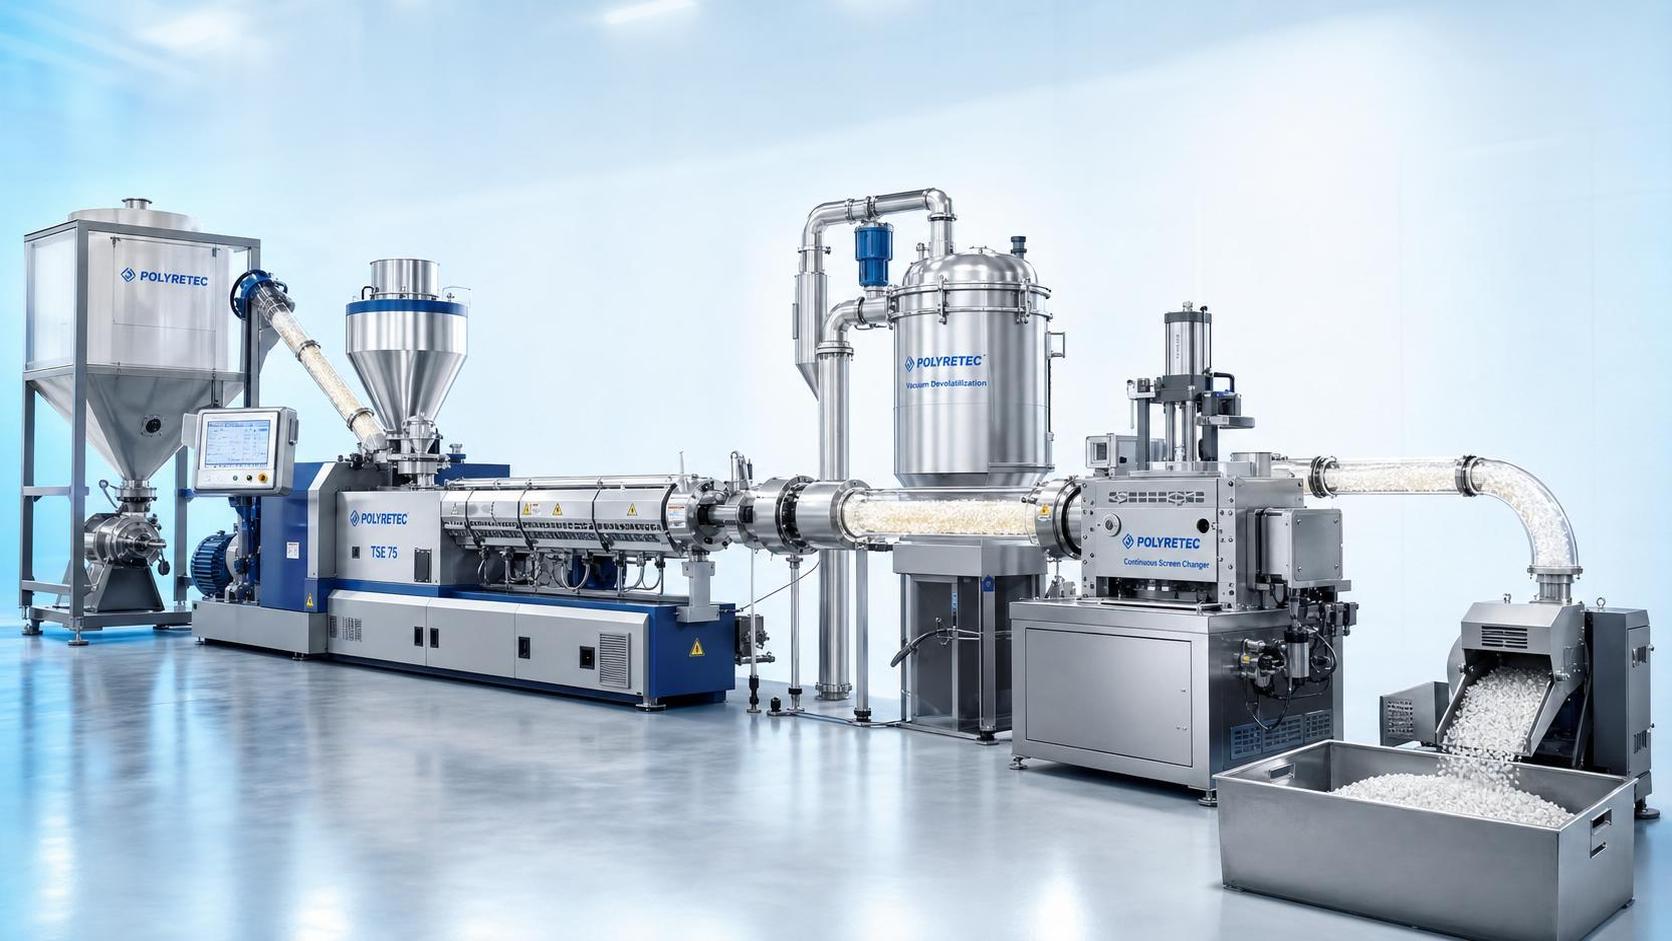
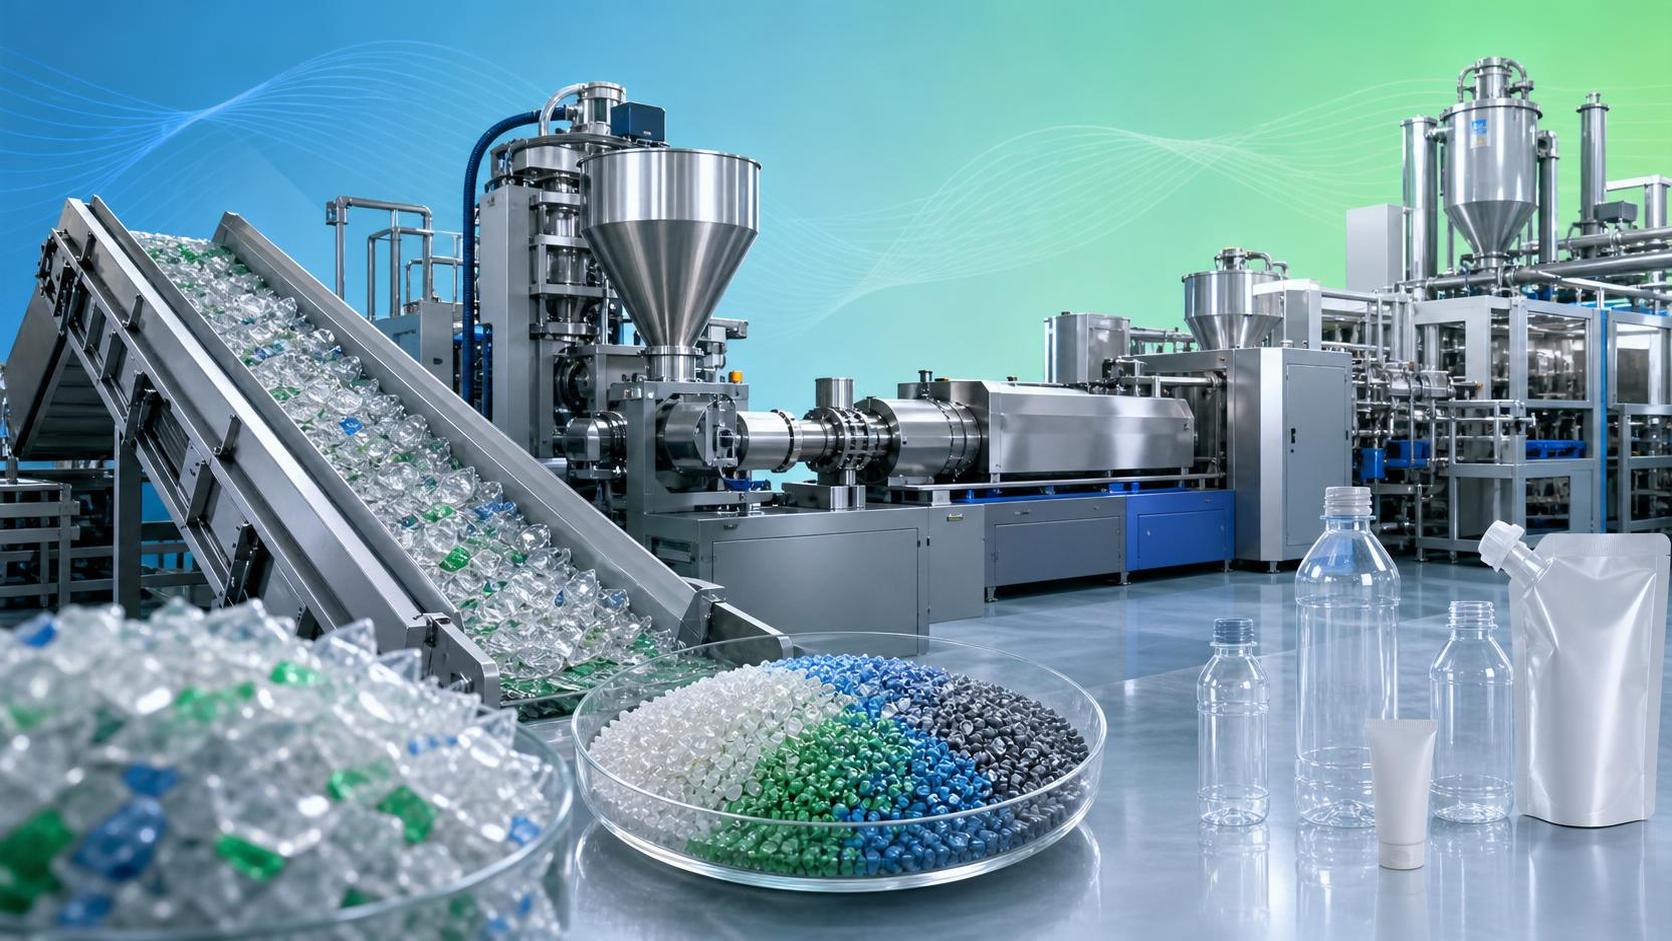
Recycled streams are rarely uniform. Melt flow can shift with contamination, degradation, moisture, and mixed polymer fractions. Because of that, non-Newtonian fluid simulations are highly relevant in washing, melting, filtration, degassing, and pelletizing line optimization.
The practical value lies in pressure stability at screens, reduced black specks, gentler thermal history, and more predictable pellet quality. Those outcomes directly support circular economy targets and more reliable use of reprocessed resin.
Common blind spots that weaken decisions
Using generic material curves. A broad database entry may not represent the actual resin grade, filler package, or recycled blend in production. Small rheology errors can distort pressure and temperature conclusions.
Ignoring degradation effects. Some models treat viscosity as stable even when chain scission, oxidation, or moisture-driven damage is occurring. That can hide real quality risk during long residence or repeated heat exposure.
Separating flow from mechanics. A part may fill well in simulation but still fail warpage, seal, or burst requirements. Flow results should connect with structural and dimensional outcomes.
Overlooking machine dynamics. Real systems include screw recovery limits, servo response, heater lag, valve-gate timing, and pressure fluctuations. Non-Newtonian fluid simulations become more useful when those realities are included.
Assuming one-time validation is enough. Equipment wear, resin changes, and throughput increases can shift the process window. Simulation credibility must be maintained through periodic recalibration.
How to apply results in a practical review cycle
- Start with one decision question, such as reducing pressure loss, stabilizing fill balance, increasing output, or lowering thermal damage.
- Define acceptance metrics before modeling. Use numbers like peak pressure, melt temperature spread, cycle time, torque, scrap rate, or thickness variation.
- Run two or three realistic scenarios instead of many weak ones. Focus on geometry, material, and operating changes that production could actually adopt.
- Compare simulation outputs with machine logs and quality records. Give more weight to models that explain existing variation patterns.
- Prioritize actions by payback speed. Choose changes that can quickly cut scrap, increase usable throughput, or reduce unstable operating windows.
A disciplined review cycle keeps non-Newtonian fluid simulations connected to operations. It also helps teams avoid overinvesting in redesign when a narrower process correction would solve the problem faster.
Conclusion and next-step guidance
When used correctly, non-Newtonian fluid simulations improve process decisions by making polymer flow behavior measurable, comparable, and actionable. Their real strength is not visualization alone. It is the ability to connect rheology with throughput, quality, stability, energy, and risk.
The most effective next step is simple: review one current bottleneck with the checklist above, validate the material model, and link simulation outputs to plant data. That approach builds stronger evidence for optimization, equipment selection, and long-term process improvement across modern polymer manufacturing.
Related News
- 00
0000-00
Smart Factory Costs for Plastics: Estimating ROI for Automation Projects - 00
0000-00
How to Evaluate a Packaging Molding Equipment Supplier for High-Volume Production - 00
0000-00
Where Recycled Plastic Innovation Delivers the Biggest Value in Packaging - 00
0000-00
How to Evaluate a Tire Curing Equipment Supplier for Capacity, Support, and Uptime - 00
0000-00
How to Size a Servo Injection Molding Press for High-Precision Parts
Weekly Insights
Stay ahead with our curated technology reports delivered every Monday.
Related News
 Prof. Marcus ChenWhere Recycled Plastic Innovation Delivers the Biggest Value in PackagingRecycled plastic innovation delivers the greatest packaging value through proven material loops, reliable processing, compliance readiness, and circular design.Oct 08, 2026
 Prof. Marcus ChenEnergy-Efficient Polymer Processing: Where Plants Can Cut kWh per KilogramEnergy-efficient polymer processing solutions help plants reduce kWh per kilogram, protect quality, cut scrap, and prioritize upgrades with data-driven insights.Sep 23, 2026
 Prof. Marcus ChenPlastic Pelletizing Trends: How Recycling Demand Is Reshaping Processing TechnologyPlastic pelletizing trends are redefining recycling quality. Explore filtration, extrusion, degassing, and automation innovations driving cleaner, more consistent recycled resin.Sep 07, 2026
 Prof. Marcus ChenHow Polymer Supply Chains Are Changing to Support High-Quality Recycling FeedstockPolymer supply chain for recycling is shifting toward traceable sourcing, cleaner sorting, and stable processing. See how high-quality feedstock improves performance, compliance, and cost control.Aug 22, 2026
 Prof. Marcus ChenHow Europe’s Circular Plastics Economy Is Reshaping Recycling InvestmentCircular plastics economy Europe is reshaping recycling investment through quality, traceability, and packaging demand. Explore where capital is moving and why it matters now.Aug 04, 2026
 Prof. Marcus ChenBlow Molding Trends Shaping Packaging, Sustainability, and Production EfficiencyBlow molding trends are redefining packaging with lightweighting, recycled content, automation, and energy efficiency. Discover how smarter production boosts sustainability and cuts costs.Jul 23, 2026
 Prof. Marcus ChenExtrusion Equipment Modular Design: When It Makes Sense for Line ExpansionExtrusion equipment modular design helps manufacturers expand lines in phases, cut disruption, and stay ready for recycled content, utility limits, and changing product demands.Jul 15, 2026
 Prof. Marcus ChenPolymer Lifecycle Solutions Explained: From Material Sourcing to End-of-Life RecoveryPolymer lifecycle solutions explained from sourcing and processing to recycling and recovery. Discover how to cut waste, improve quality, and build smarter material strategies.Jul 13, 2026
 Prof. Marcus ChenEnergy-Efficient Polymer Processing Systems: Which Metrics Matter Most?Energy-efficient polymer processing systems: discover the metrics that truly drive ROI—specific energy use, yield, uptime, stability, and compliance for smarter equipment decisions.Jul 11, 2026
 Prof. Marcus ChenPolymer Recycling Systems for Continuous Operation: What to Check Before SpecifyingPolymer recycling systems continuous operation starts with the right specification. Learn what to check for uptime, melt quality, energy efficiency, and reliable pellet output.Jul 09, 2026
 Prof. Marcus ChenCircular Plastics Economy in Japan: Policy Drivers, Recycling Targets, and Market ImpactCircular plastics economy Japan is accelerating as policy, recycling targets, and packaging reforms reshape material choices, processing strategy, and market advantage.Jul 05, 2026
 Prof. Marcus ChenPlastic Extrusion Technology Trends: What Process Changes Are Improving Energy Efficiency?Plastic extrusion technology trends are reshaping energy efficiency through smarter screws, thermal control, servo drives, and digital optimization. See which process changes deliver lower costs and more stable output.Jul 01, 2026
 Prof. Marcus ChenInjection Molding Technology Trends: Which Process Changes Matter Most for Medical and Packaging Parts?Injection molding technology trends shaping medical and packaging parts: discover the process changes that improve validation, precision, efficiency, and recycled-material readiness.Jun 30, 2026
 Prof. Marcus ChenCircular Plastics Economy Compliance Explained: Key Requirements for ManufacturersCircular plastics economy compliance explained for manufacturers: learn key requirements, audit risks, process controls, and how to turn compliance into a competitive advantage.Jun 25, 2026
 Prof. Marcus ChenAdvanced Materials Processing Trends: 5 Shifts Reshaping Capacity Planning and SourcingAdvanced materials processing trends are reshaping capacity planning, sourcing, recycling, and compliance. Explore 5 shifts helping manufacturers cut risk, improve precision, and build resilient growth.Jun 24, 2026
 Prof. Marcus ChenGlobal Plastic Ban Trends: Which Packaging Materials and Export Markets Face the Biggest Changes?Global plastic ban trends are reshaping packaging choices and export strategy. See which materials and markets face the biggest shifts, and how to reduce compliance risk.Jun 22, 2026
 Prof. Marcus ChenPolymer Rheology Trends That Matter in Extrusion: Melt Strength, Shear, and StabilityPolymer rheology trends are reshaping extrusion performance. Learn how melt strength, shear, and stability affect quality, efficiency, and recycled resin processing.Jun 18, 2026
 Prof. Marcus ChenPlastic Circularity Strategies for Manufacturers: Recycled Content, Design, and TraceabilityPlastic circularity strategies for manufacturers: learn how recycled content, smarter design, and traceability can reduce risk, improve compliance, and strengthen supply resilience.Jun 18, 2026
 Prof. Marcus ChenAdvanced Materials Processing Equipment in High-Performance Manufacturing: Where It Fits BestAdvanced materials processing equipment drives precision, speed, and sustainability in manufacturing. Explore where each system fits best to improve quality, efficiency, and ROI.Jun 16, 2026
 Prof. Marcus ChenWhat Is Driving the Circular Economy Plastics Market? Policy, Pricing, and Demand ShiftsCircular economy plastics market trends are being driven by tighter policy, resin price volatility, and stricter buyer demands. Discover what this means for sourcing, processing, and growth.Jun 13, 2026