How to Compare Pelletizing Lines by Energy Use per Ton




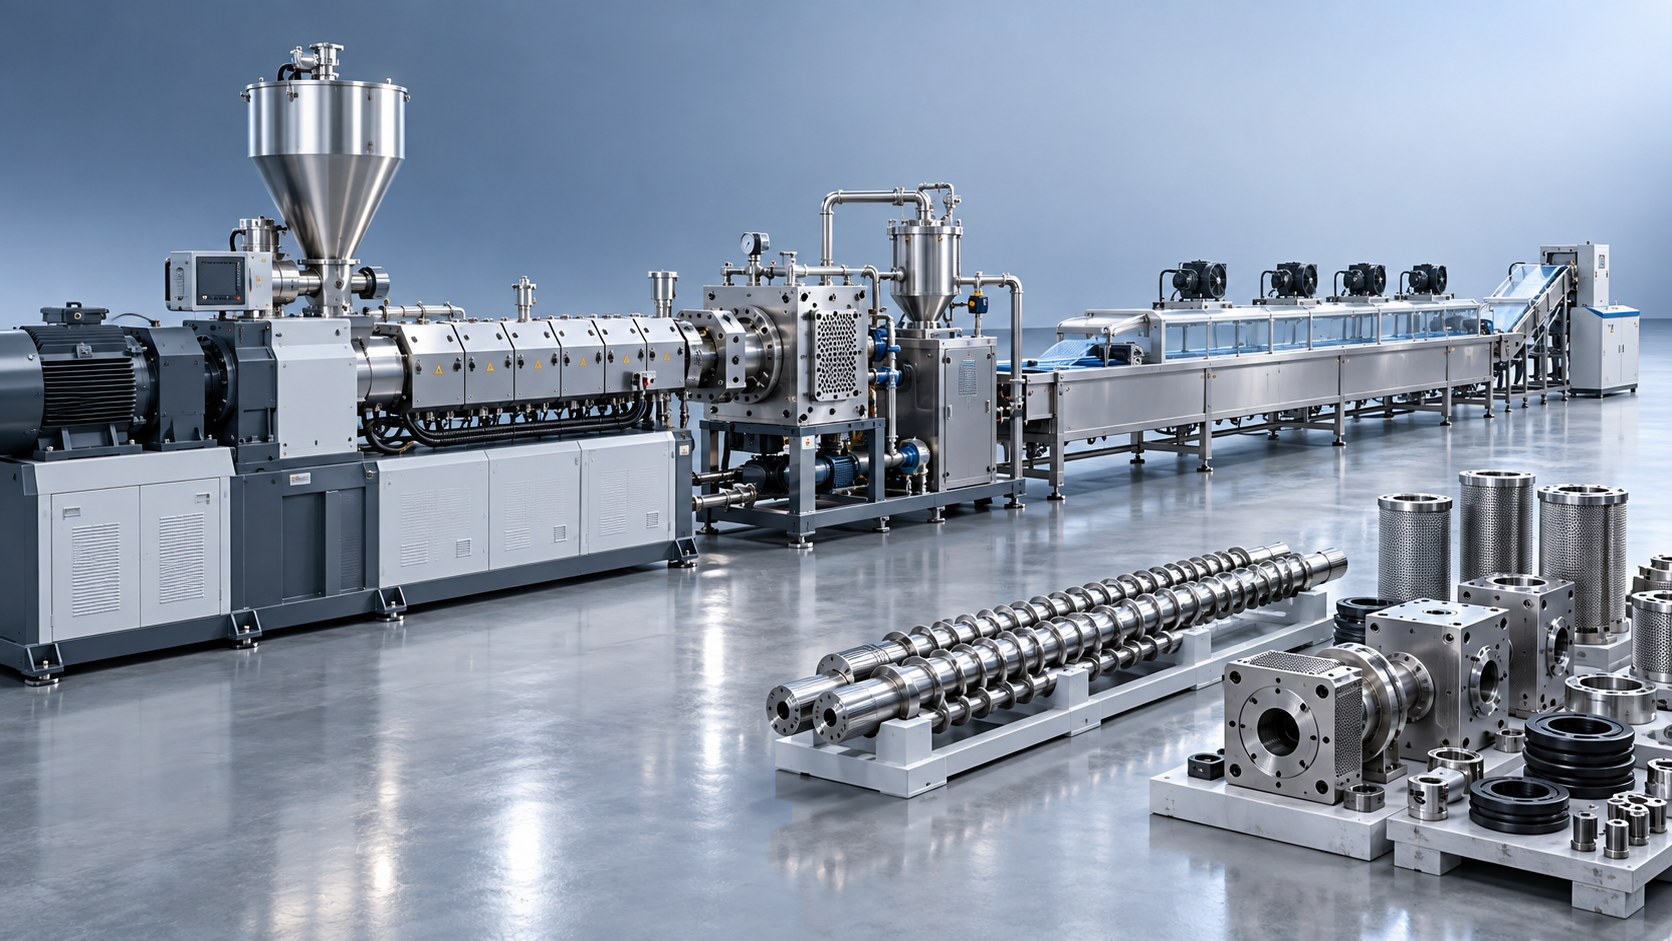
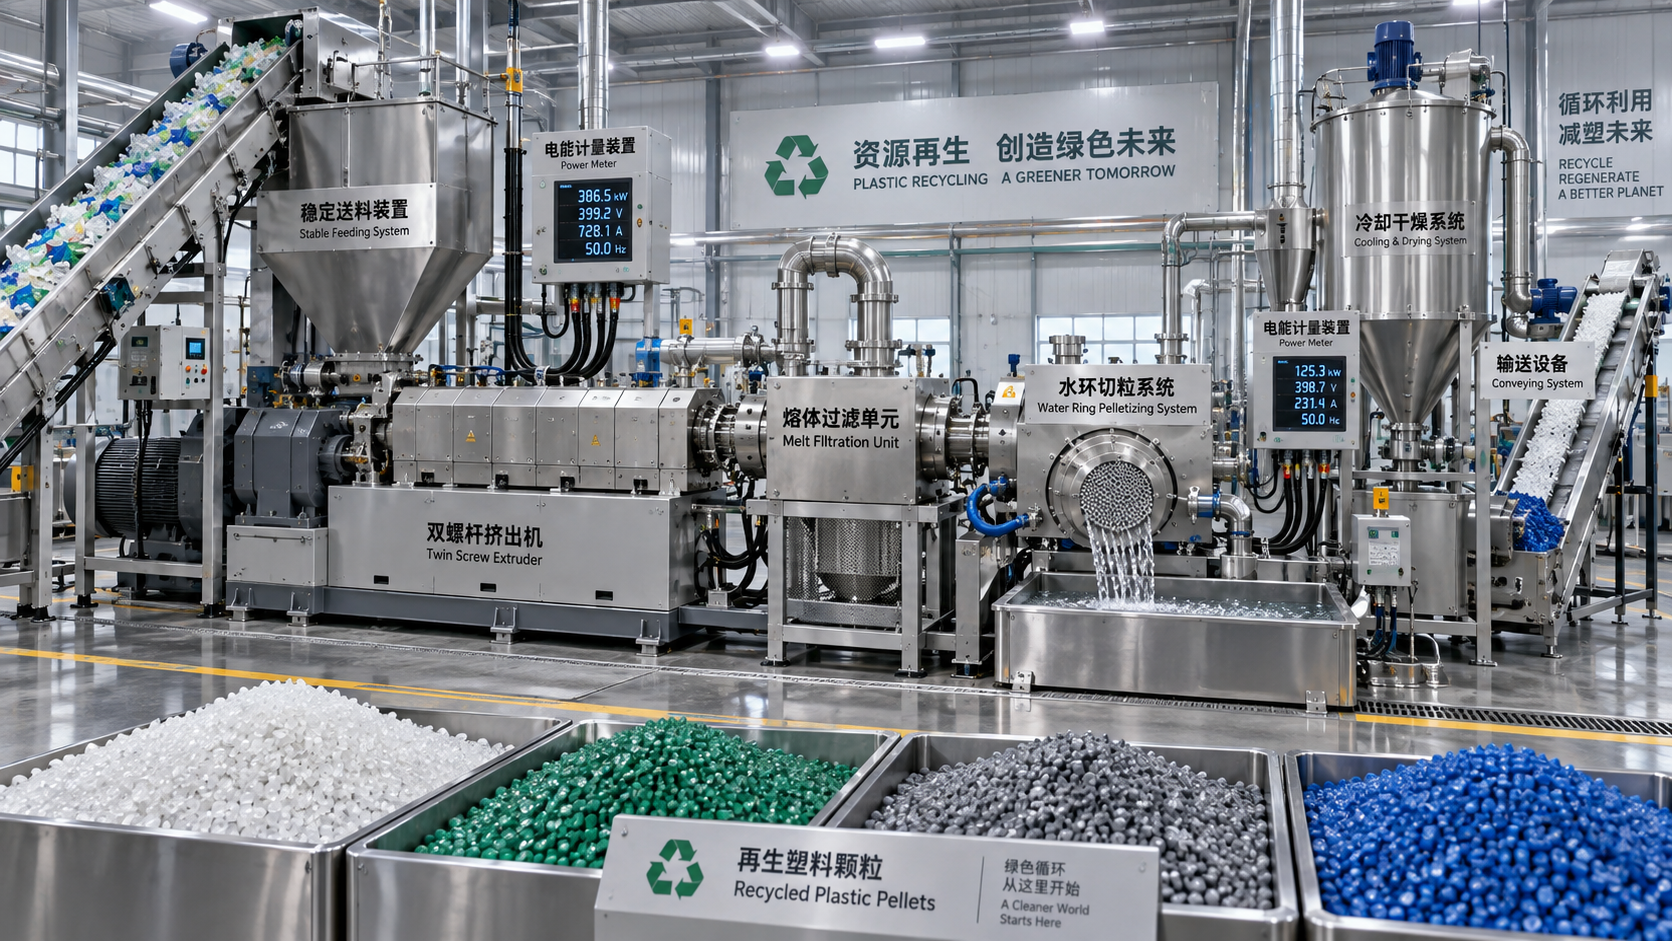
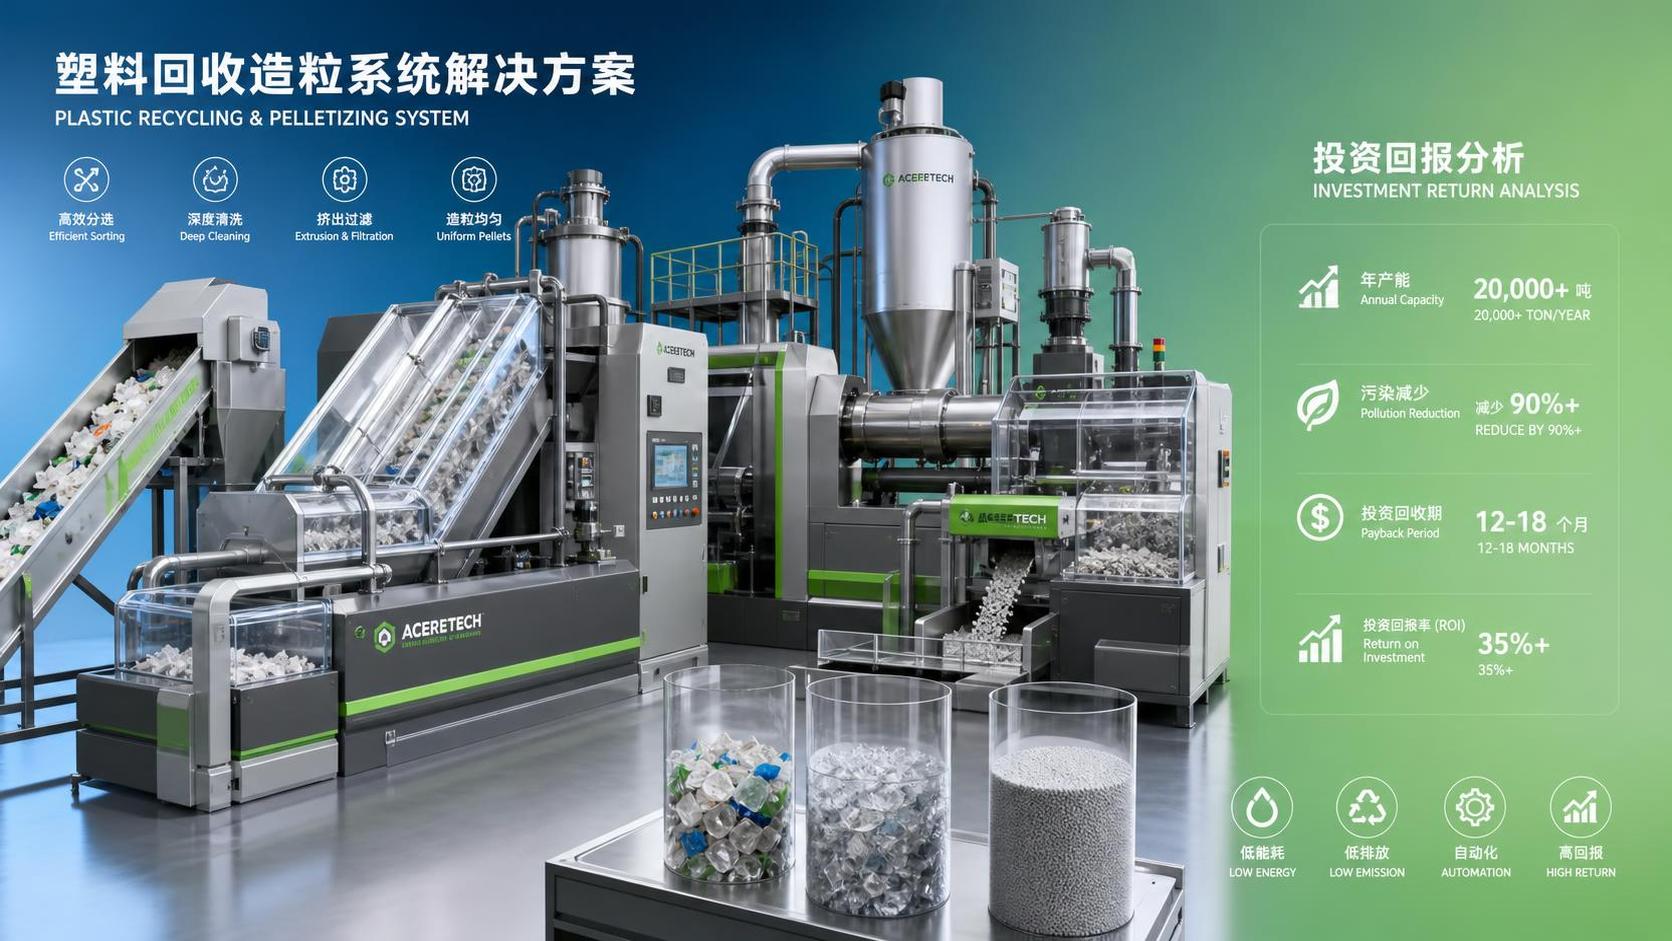
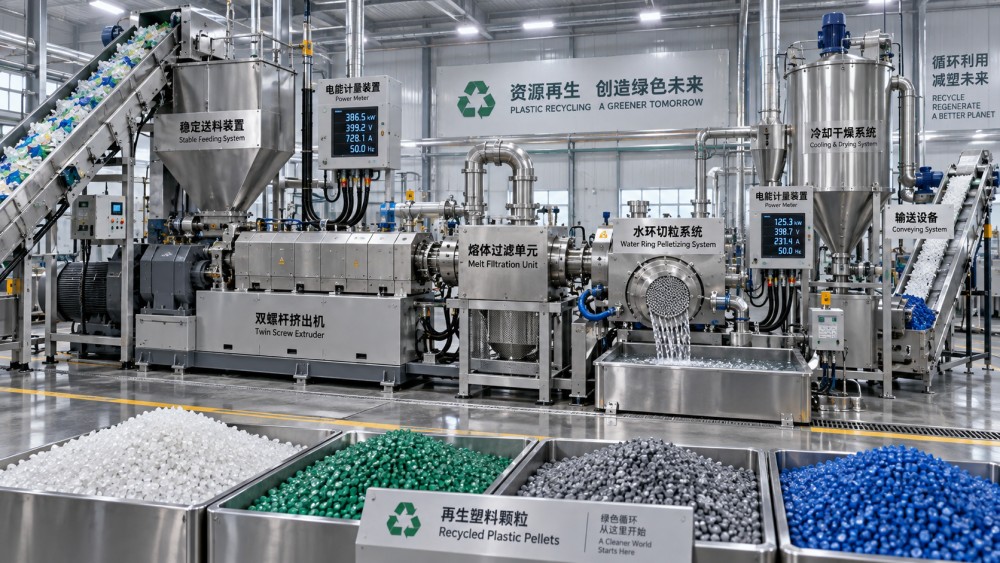
A pelletizing line can look efficient on a supplier’s layout drawing and still become an expensive energy consumer once it meets real feedstock. The reason is simple: pellets are produced by a system, not by an extruder alone. Feed preparation, densification, melting, degassing, melt filtration, pellet cutting, cooling, drying, conveying, and control logic all draw power—and all can change with material quality.
So, how do I compare pelletizing lines by kWh per ton? Begin with a common operating boundary and measure the total electricity consumed to produce one metric ton of acceptable pellets. That definition sounds straightforward, but it prevents many of the misleading comparisons that occur when one quotation includes only the main extruder motor while another includes the complete recycling system.
For recyclers, compounders, and polymer processors, kWh per ton is more than a sustainability indicator. It connects directly to conversion cost, carbon reporting, production stability, and the margin available when resin markets become volatile. A line that uses slightly more energy but produces consistently clean, sellable pellets at a higher uptime may be the better investment. The useful comparison is therefore not “lowest number wins,” but “lowest verified energy per ton of conforming output under comparable conditions.”
Define the comparison boundary before reviewing any numbers
The most common mistake is comparing a vendor’s “specific energy consumption” figure without asking what is inside the calculation. A pelletizing system may be sold as a compact extrusion-and-pelletizing package, while the actual operation includes upstream washing, mechanical drying, storage, material transport, and downstream pellet handling. If the scope differs, the kWh-per-ton figures are not comparable.
Before evaluating equipment, write down the boundary of the line you are comparing. For a practical, plant-level assessment, it should normally include the electrical loads from prepared feed entering the pelletizing section until finished pellets reach the designated discharge or storage point.
- Feeding equipment, such as belt conveyors, force feeders, crammers, or densifiers
- Extruder drive, barrel heaters, cooling fans, and vacuum degassing units
- Screen changer or continuous melt filtration system, including hydraulic power units
- Pelletizing equipment: strand cutter, water-ring unit, underwater pelletizer, or die-face cutter
- Cooling-water pumps, process-water treatment, centrifuges, blowers, and dryers
- Pellet conveying, classifiers, metal detection, and packaging or transfer equipment where applicable
- Control cabinets, auxiliaries, and any integrated automated start-up or shutdown functions
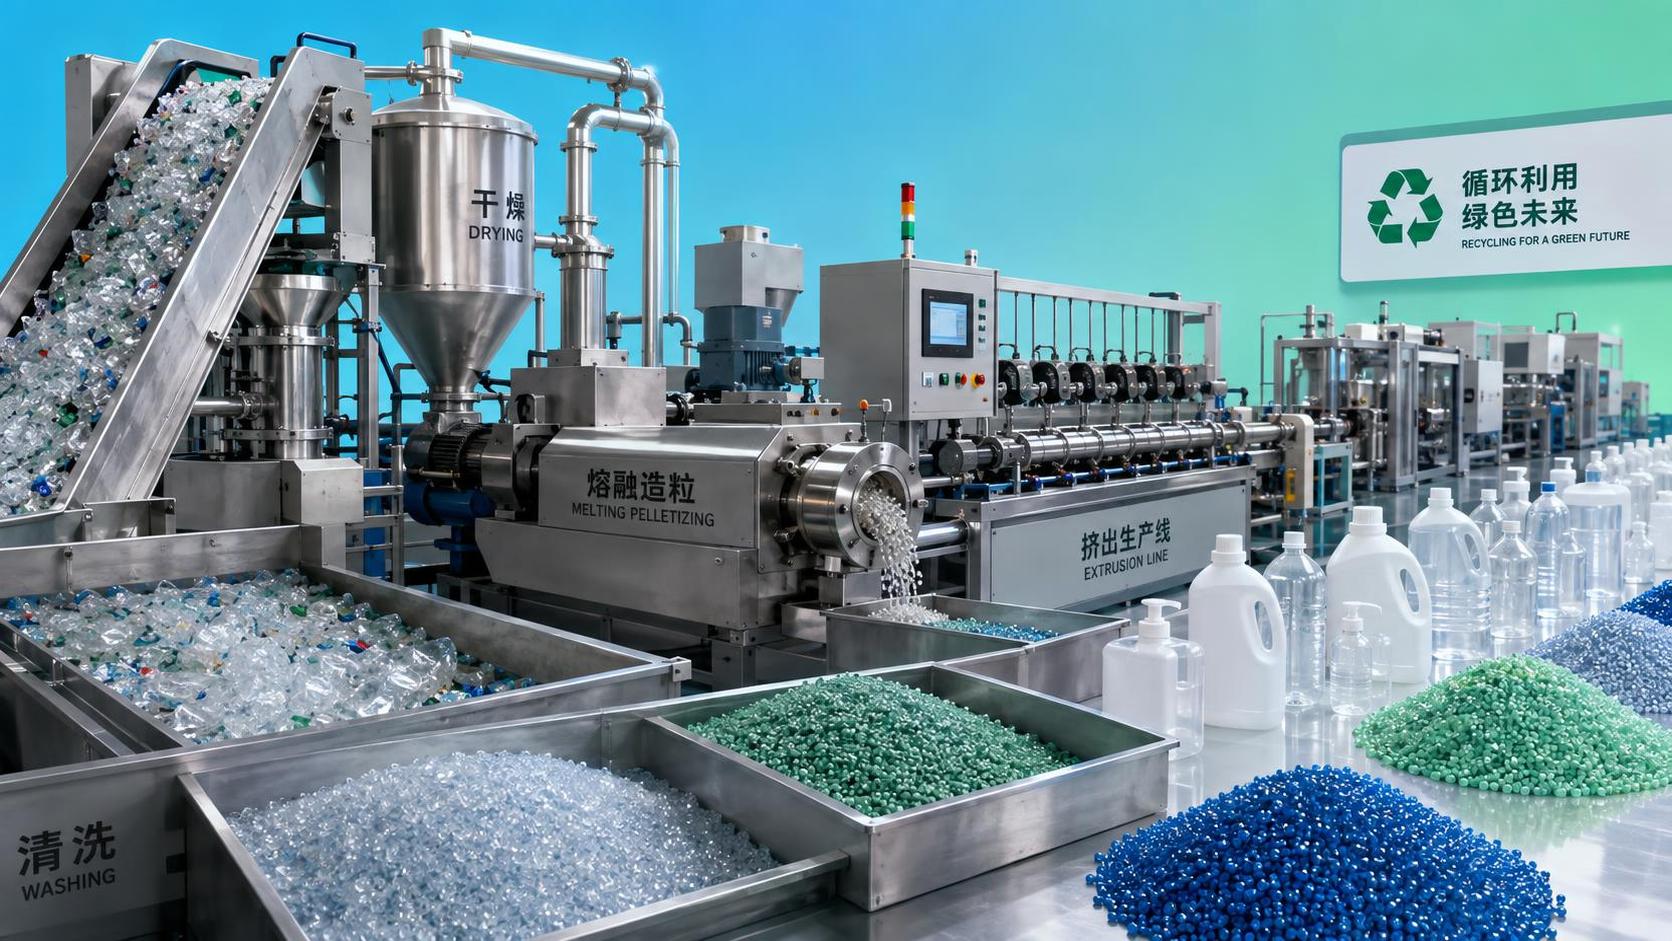
Some projects need a wider boundary. If a recycler is deciding between lines that include washing, then electricity for shredding, friction washing, thermal drying, and wastewater treatment should also be separated and reported. The key is not choosing one universal boundary; it is using the same boundary for every option.
The core calculation: total energy divided by good output
The basic formula is:
Specific energy consumption (kWh/t) = Total electrical energy consumed (kWh) ÷ Net mass of accepted pellets produced (t)
“Accepted pellets” matters. The denominator should not be the theoretical throughput shown on an HMI screen, nor the total material charged into the system. It should be the measured output that meets the agreed quality requirement after normal process losses, purge material, contamination removal, and rejects.
For example, if a line consumes 2,400 kWh during a production period and generates 12 tonnes of saleable pellets, its measured consumption is 200 kWh/t. If 12 tonnes were fed but only 10.8 tonnes became approved pellets because of moisture, contamination, start-up losses, or unstable filtration, the relevant result is 222.2 kWh/t. That difference can materially affect annual operating cost.
Use a revenue-grade or properly calibrated submeter rather than relying solely on machine nameplate ratings. Motor ratings show the maximum installed capacity, not actual draw. A high-torque extruder does not necessarily use more electricity than a smaller machine if it reaches stable output faster, avoids repeated shutdowns, and operates closer to its efficient load range.
Make the test conditions comparable—or the result has little meaning
Pelletizing energy is strongly influenced by feedstock condition. Comparing a clean, dry post-industrial LDPE film trial with a contaminated post-consumer film production run tells you very little about the equipment. The same applies to rigid PP regrind, PET flakes, ABS scrap, heavily printed films, agricultural film, and multi-layer packaging: each material brings its own moisture level, bulk density, contamination profile, melt behavior, and filtration demand.
A meaningful test protocol should document the following conditions:
Ideally, compare lines at their intended production rate, after reaching thermal and mechanical stability. A short demonstration can be useful, but a multi-hour or shift-based record provides a more credible picture. If a supplier offers a number based on a laboratory trial, request the operating assumptions behind it rather than treating it as a guaranteed plant result.
Why the extruder’s installed power is not the answer
Buyers often begin by comparing the main motor: 250 kW versus 315 kW, for instance. It is an understandable shortcut, but it can lead to the wrong conclusion. Installed motor power reflects the machine’s available torque and operating envelope. It does not reveal how much energy is used per tonne at the required output and material condition.
A line with a larger motor may run at lower relative load, handle fluctuation without frequent choking, and maintain a steadier melt temperature. Another may appear smaller on paper yet require aggressive screw speed, frequent operator intervention, or longer recovery after screen changes. The energy meter sees the whole production reality.
Look instead at the energy profile across the line. In many recycling applications, the largest opportunities are not limited to the extruder drive. Consider:
- Feeding stability: Poorly densified film or inconsistent regrind can cause surging. Surging lowers net output while heaters, pumps, and cooling equipment continue consuming power.
- Screw and barrel design: A configuration suited to the polymer and contamination level can achieve melting, mixing, venting, and pressure generation with less unnecessary shear.
- Heating and cooling control: Overshooting temperature setpoints wastes energy and can degrade sensitive materials. Well-tuned zones reduce the constant “heat, then correct” cycle.
- Melt filtration: Finer filtration can improve pellet quality, but pressure drop and frequent screen replacement may increase energy and downtime. The right filtration strategy balances both.
- Pelletizing method: Strand, water-ring, and underwater systems have different thermal and water-management demands. The best choice depends on polymer behavior, output, pellet geometry, and quality targets.
- Water and air systems: Pumps, chillers, centrifuges, and blowers can become meaningful loads, particularly in high-throughput or tightly specified pellet drying operations.
Compare the line at stable throughput, not at a single peak number
Specific energy tends to improve as a line moves from low load toward stable design throughput because certain loads remain relatively fixed. Vacuum pumps, control systems, cooling circulation, and conveying equipment consume electricity whether the line is producing 300 kg/h or 800 kg/h.
That does not mean every line should be judged only at maximum output. Running at the edge of capacity can create excessive wear, melt-temperature variation, poor degassing, or quality drift. Ask for a performance curve showing net throughput and kWh/t across the realistic production range. If a plant expects to process several material streams, request separate curves or trial results for each important category.
A useful comparison sheet may include three operating points: a conservative rate, a normal target rate, and a high but sustainable rate. This reveals whether one system is efficient only in a narrow sweet spot or remains controlled when feedstock changes from one bale lot to the next.
Do not hide downtime inside an “energy-efficient” claim
Energy per ton is closely tied to availability. A line may show attractive consumption while running, yet perform poorly over a month because it stops repeatedly for screen changes, die cleaning, material bridging, pelletizer adjustment, or unplanned maintenance. During many stoppages, some auxiliaries remain energized, and the production denominator falls.
For capital decisions, review two related metrics:
- Running specific energy: kWh per tonne during stable production.
- Effective production energy: total kWh consumed during the scheduled production window divided by accepted tonnes produced during that same window.
The first helps assess process design. The second is often closer to the energy cost that will appear on the plant’s utility bill. Both are worth requesting, especially for difficult post-consumer material where filtration and cleaning intervals determine real productivity.
Translate kWh per ton into a decision, not just a spreadsheet ranking
Once comparable energy figures are available, convert them into annual implications. Multiply the difference in kWh/t by planned annual saleable output, then apply the site’s electricity tariff. If carbon reporting is relevant, apply the organization’s approved grid-emissions factor separately. Keep energy cost and carbon calculations transparent, because electricity prices and regional grid factors change over time.
However, energy must sit alongside quality and operational economics. A lower-energy line is not automatically the best line if it produces pellets with more black specks, higher residual moisture, unstable melt flow, excessive odor, or unacceptable contamination. Those outcomes can lower the selling price or restrict the material to less valuable applications.
For that reason, a balanced procurement model normally weighs:
- Measured kWh/t under documented feedstock conditions
- Net saleable throughput and yield
- Pellet quality consistency and application fit
- Operator requirements and automation level
- Filter consumption, water use, wear parts, and maintenance access
- Ability to handle expected changes in feedstock quality
- Data collection capability for energy, production, alarms, and traceability
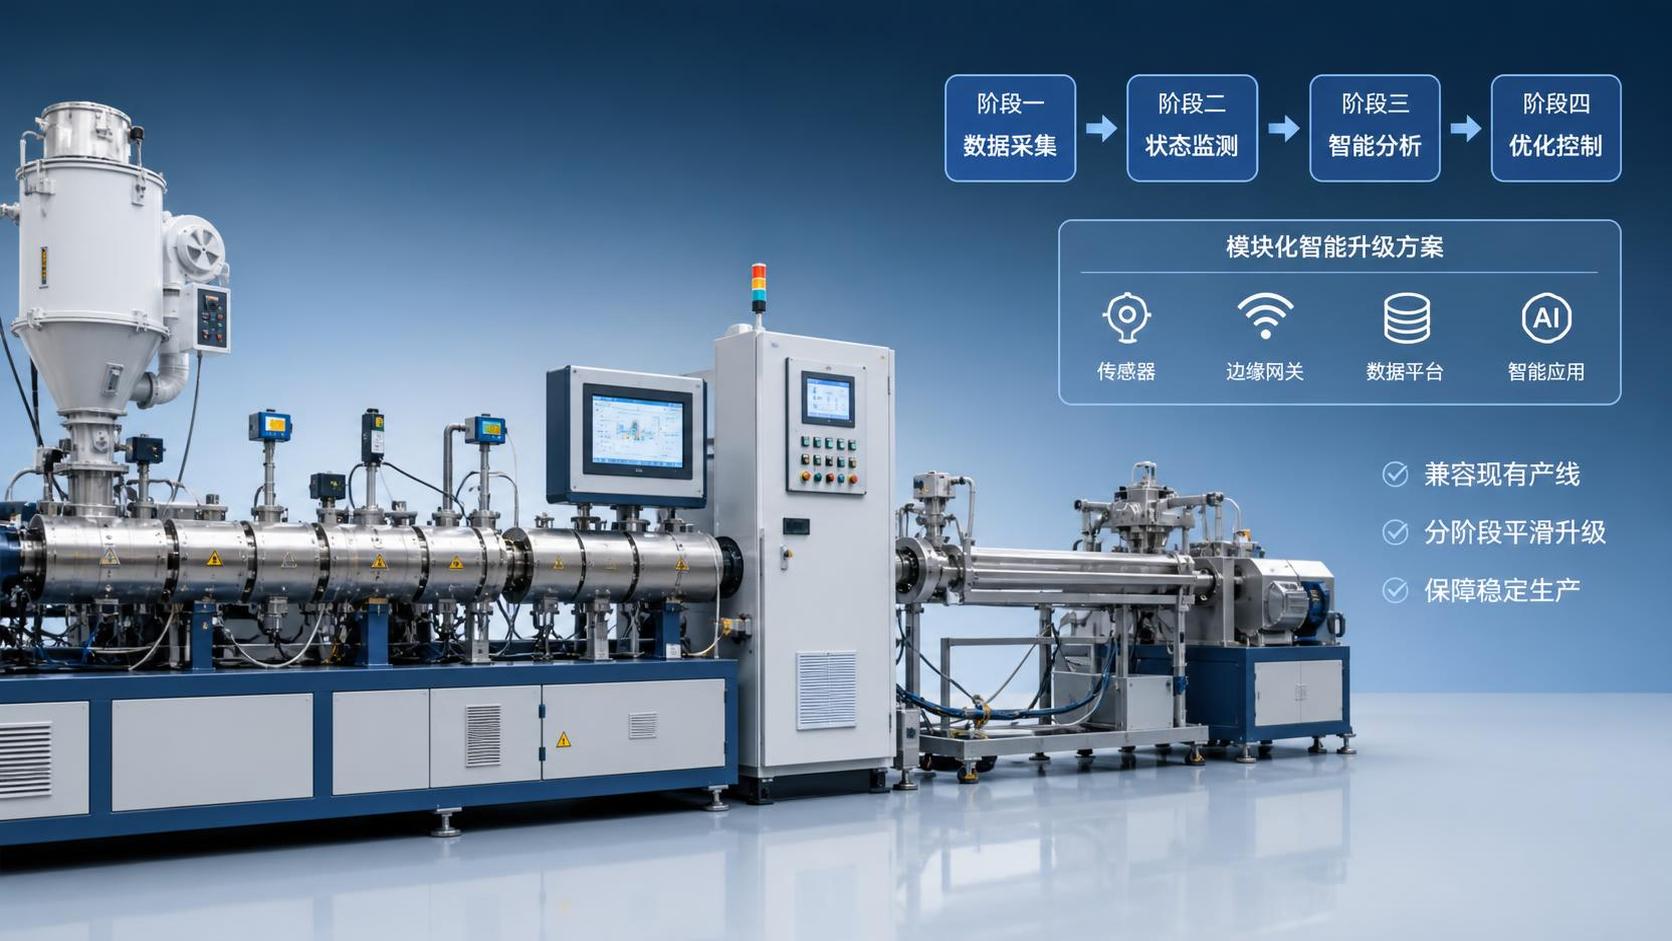
Digital monitoring deserves particular attention. A modern line should make it possible to trend total energy, individual load groups, melt pressure, torque, temperature, vacuum condition, and output over time. When these signals are viewed together, energy spikes stop being mysterious. They can often be linked to wet feedstock, a loading screen, unstable feeding, incorrect temperature settings, or a declining cooling-water condition.
Questions to ask every pelletizing-line supplier
A technically useful quotation should survive a few direct questions. Ask: “What equipment is included in your stated kWh/t figure?” “What polymer, moisture level, contamination level, and filtration configuration were used?” “Is the output gross throughput or accepted pellet output?” “Was the result measured at the meter, estimated from installed loads, or calculated from a test?” “How long did the trial run after stabilization?”
Also ask for the likely energy impact of optional equipment. An automatic screen changer, enhanced degassing package, intensive densifier, or underwater pelletizer may add electrical load, but it may also improve yield, reduce labor, stabilize output, or enable a more demanding recycled-content application. The right answer depends on the full process, not on a single component’s consumption.
A practical final rule for comparing pelletizing lines
When evaluating pelletizing equipment, compare measured total kWh per tonne of accepted pellets under the same feedstock, quality target, throughput range, and system boundary. Then examine how that figure holds up through normal operating events—not merely during a clean, short demonstration.
This approach gives processors a clearer view of the relationship between polymer rheology, line configuration, and operating cost. It also supports the broader goal of circular plastics processing: converting variable waste streams into reliable secondary raw materials with less avoidable energy, less material loss, and better production intelligence. In a market where both margins and environmental obligations are tightening, that is the comparison that matters.
Related News
- 00
0000-00
Energy-Efficient Polymer Processing: Where Plants Can Cut kWh per Kilogram - 00
0000-00
German Extrusion Equipment Suppliers: Comparing Service, Lead Times, and Lifecycle Cost - 00
0000-00
What Causes Black Specks in Recycled Plastic Pellets? - 00
0000-00
How to Compare Pelletizing Lines by Energy Use per Ton - 00
0000-00
How Curing Press Control Shapes Uniformity and Tread Life in Truck Tire Manufacturing
Weekly Insights
Stay ahead with our curated technology reports delivered every Monday.
Related News
 Ms. Elena RodriguezGerman Extrusion Equipment Suppliers: Comparing Service, Lead Times, and Lifecycle CostExtrusion equipment Germany suppliers compared: evaluate service coverage, credible lead times, spare-parts access, and lifecycle cost to select a reliable, future-ready production partner.Sep 22, 2026
 Ms. Elena RodriguezHow to Compare Pelletizing Lines by Energy Use per TonHow do I compare pelletizing lines by kWh per ton? Learn to measure total energy, verify saleable output, and select a cost-efficient line.Sep 23, 2026
 Ms. Elena RodriguezIn-House Recycling for Factory Scrap: How to Reduce Material Waste and Disposal CostsIn house recycling for factory scrap helps manufacturers cut material waste, reduce disposal costs, and create controlled, quality-focused reuse loops.Sep 07, 2026
 Ms. Elena RodriguezHow Recyclable Packaging Manufacturing Balances Material Recovery and Production CostRecyclable packaging manufacturing: discover how smarter design, feedstock control, and process optimization reduce recovery costs while improving quality and yield.Sep 04, 2026
 Ms. Elena RodriguezHow to Evaluate a Plastic Recycling Systems Supplier for Your Processing NeedsChoose the right plastic recycling systems supplier with a practical guide to feedstock fit, output quality, total cost, testing, service, and compliance.Sep 01, 2026
 Ms. Elena RodriguezCE Marking for Plastic Processing Equipment: Documentation and Safety ChecksPlastic processing equipment CE compliance: learn the essential documentation, risk assessments, safety checks, and validation steps for reliable EU market access.Aug 30, 2026
 Ms. Elena RodriguezPlastic Packaging Compliance Standards: What Tests and Documents Matter Most?Plastic packaging compliance standards explained: learn which migration tests, mechanical checks, and audit-ready documents matter most to reduce risk and pass reviews with confidence.Aug 25, 2026
 Ms. Elena RodriguezHow to Evaluate a Plastic Waste Recycling System for Capacity, Contamination, and ROIPlastic waste recycling system evaluation made practical: compare true capacity, contamination control, and ROI to choose a line that delivers stable output and stronger returns.Aug 24, 2026
 Ms. Elena RodriguezPackaging Molding Equipment Price: What Drives Cost and How to Compare Quotes?Packaging molding equipment price varies by machine type, automation, tooling, energy use, and service scope. Learn what drives cost and how to compare quotes with confidence.Aug 21, 2026
 Ms. Elena RodriguezWhat Packaging Machinery for Plastic Containers Should You Choose for High-Volume Production?Packaging machinery for plastics containers can make or break high-volume production. Learn how to choose the right line for speed, consistency, compliance, and lower lifecycle costs.Aug 16, 2026
 Ms. Elena RodriguezWhat Circular Plastics Mean for Automotive Parts and Material SelectionCircular plastics for automotive are reshaping part selection with lower weight, better sustainability, and reliable performance. Discover how engineers balance recycled content, durability, and compliance.Aug 15, 2026
 Ms. Elena RodriguezBroiler Farming in Cage System: Selection Factors for Commercial FarmsBroiler farming in cage system selection for commercial farms: compare structure, ventilation, automation, and manure handling to improve efficiency and avoid costly mistakes.Aug 14, 2026
 Ms. Elena RodriguezHow to Implement Smart Polymer Manufacturing Without Disrupting Existing Production?Smart polymer manufacturing implementation made practical: learn how to upgrade existing production with phased digitalization, less downtime, better control, and measurable ROI.Aug 11, 2026
 Ms. Elena RodriguezHow to Evaluate a Rubber Compression Molding Supplier for Complex Part ProductionRubber compression molding supplier selection for complex parts starts with process, material, and tooling control. Learn how to compare vendors beyond price and reduce launch risk.Aug 10, 2026
 Ms. Elena RodriguezPackaging Compliance in Canada: Key Labeling and EPR Rules Importers Must KnowPackaging compliance Canada explained for importers: learn bilingual labeling, environmental claims, and provincial EPR rules to reduce risk, avoid costly errors, and stay market-ready.Aug 03, 2026
 Ms. Elena RodriguezWhy Circular Plastics Economy Traceability Matters for Recycled Content ComplianceCircular plastics economy traceability is essential for proving recycled content compliance across sourcing, processing, and reporting. Learn how strong evidence reduces audit risk.Aug 02, 2026
 Ms. Elena RodriguezRecycled Plastic Compliance: Key Standards, Testing Requirements, and DocumentationRecycled plastic compliance explained: key standards, testing requirements, supplier documents, and food-contact risks to help you avoid approval delays and costly compliance mistakes.Aug 01, 2026
 Ms. Elena RodriguezHow to Evaluate an Extrusion Machinery Manufacturer for Quality, Support, and ROIExtrusion machinery manufacturer selection affects quality, uptime, and ROI. Learn how to compare process fit, output claims, service, compliance, and long-term operating costs.Jul 29, 2026
 Ms. Elena RodriguezHow to Evaluate Food Grade Recycled Pellets for Safe Packaging ApplicationsFood grade recycled pellets for safe packaging demand more than a label. Learn how to assess feedstock, process validation, pellet quality, and compliance before approval.Jul 28, 2026
 Ms. Elena RodriguezHow to Evaluate a Rubber Vulcanization Supplier for Quality, Capacity, and Lead TimeRubber vulcanization supplier selection made easier: learn how to assess quality systems, true production capacity, and lead time reliability to reduce sourcing risk and improve supply performance.Jul 25, 2026